
Story
Historical Data Points to Small-Cap Leadership in Year-End 'Santa Claus Rally'
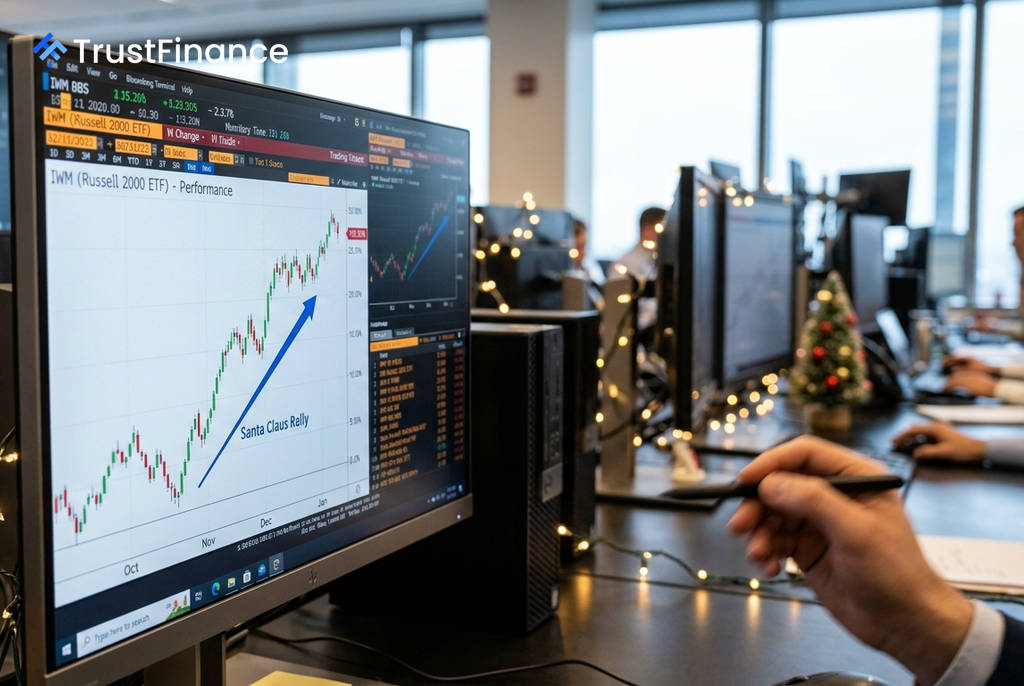
As investors look ahead to the final quarter of the year, historical market data highlights a well-documented seasonal trend known as the "Santa Claus Rally," which typically begins in mid-October. Analysis shows this period has historically favored small-capitalization and technology stocks, placing them on the radar for those tracking seasonal patterns.
Small-Caps Lead Historical Gains
Data over the past decade shows that small-cap stocks have tended to outperform their large-cap peers during the key seasonal window. The period from October 15 to January 10 has seen notable performance differences among major index-tracking ETFs, according to historical price data compiled by TradeThatSwing.
- The iShares Russell 2000 ETF (IWM) averaged a return of approximately 7.2%.
- The Invesco QQQ Trust (QQQ), which tracks the Nasdaq 100, averaged roughly 6.4%.
- The SPDR S&P 500 ETF Trust (SPY) posted an average gain of about 5.8%.
This outperformance is often linked to the "January Effect," where selling pressure from year-end tax-loss harvesting subsides, leading to renewed buying interest in smaller and more beaten-down names, according to an analysis by Britannica Money.
The Seasonal Calendar
 Ad
Historically, the strongest market gains are often preceded by a period of weakness. September is the only month with a negative average return for the S&P 500 over both 10- and 20-year lookbacks, according to TradeThatSwing. This sets up a pattern where a potential August-September pullback gives way to a mid-October recovery, with November and December ranking among the strongest months on average.
The early days of the new year are also considered a critical indicator. Known as the "January Barometer," the S&P 500's performance in the first month has often signaled the trend for the rest of the year. Since 1950, when January has been a positive month, the S&P 500's average full-year return has been 17%, compared to -1.7% in years with a negative January, based on TradeThatSwing's analysis.
Market Context and Outlook
Investors considering this seasonal trend are not currently buying into a depressed market. As of early August, major ETFs like IWM, SPY, and QQQ are trading in the upper portion of their 52-week ranges. This positioning suggests that a pullback consistent with September's historical weakness could present more attractive entry points.
While seasonal tailwinds can influence the broader market, sector leadership can also play a role. Since a market high on June 2, the healthcare and financials sectors have been the top performers in the S&P 500, rising 14% and 12% respectively through late July, as reported by Reuters. However, historical patterns are not guaranteed and can be disrupted by significant macroeconomic factors such as changes in interest rate policy or geopolitical events.
Read next
More on Stocks
FTC Orders Walmart, Uber, Delta to Disclose Data on Personalized Pricing
The U.S. Federal Trade Commission is demanding nine major companies, including leading retail, travel, and gig economy firms, to provide information on how they use consumer data for setting individual prices and wages.

Google Launches Gemini 4 Carbon AI Model to Bolster Cybersecurity Capabilities
Alphabet's Google has unveiled Gemini 4 Carbon, its latest AI model specifically designed for advanced cybersecurity tasks like vulnerability detection and secure code generation. The launch escalates competition with rivals OpenAI and Anthropic in the enterprise AI market.

Oracle Shares Surge After Unveiling $225 Billion Revenue Target for 2030
Oracle stock rose sharply after the company presented a long-term financial outlook targeting at least $225 billion in annual revenue by fiscal 2030, driven by its expanding AI infrastructure business.

DOJ Scrutinizes Nvidia's $12.9B Hugging Face Deal Amid Broader Antitrust Probe, Sources Say
The U.S. Department of Justice is reportedly examining Nvidia's planned $12.93 billion acquisition of AI platform Hugging Face as part of a wider, ongoing antitrust investigation into the chipmaker's market conduct.