
Story
GM Outpaces Ford on Key Financial Metrics Despite Dividend Gap
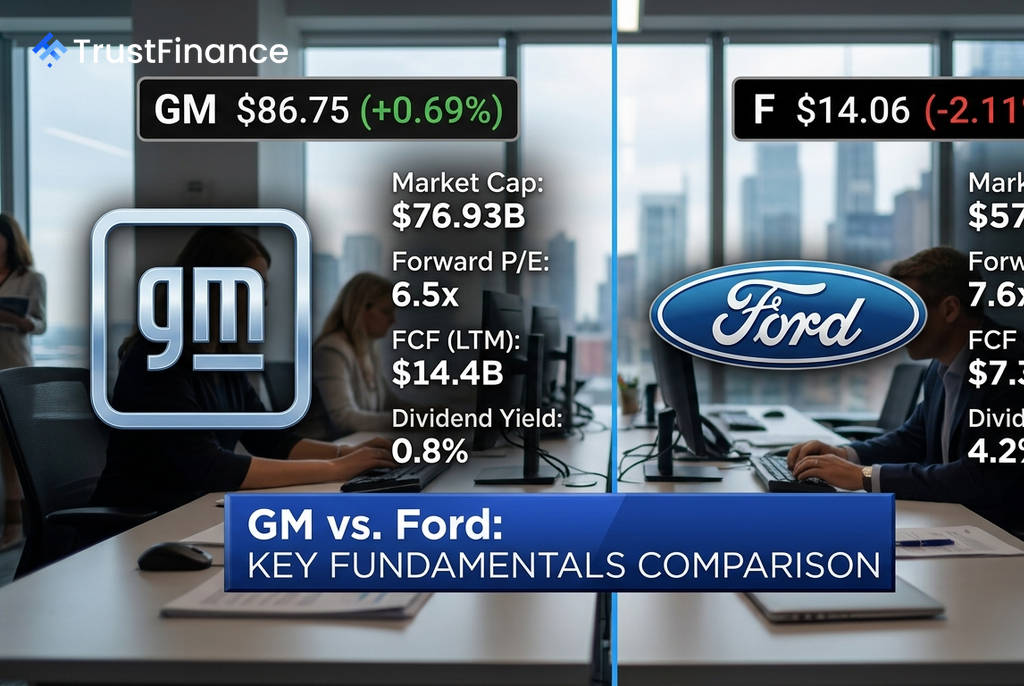
A fundamental comparison between U.S. auto giants General Motors (GM) and Ford Motor (F) reveals GM's stronger operational and financial footing across most key metrics. While Ford's dividend yield appears more attractive, it is undercut by negative profitability and a heavier debt load, according to an analysis by Investing.com.
A Fundamental Divide
On a head-to-head basis, General Motors exhibits a healthier financial profile than its primary domestic competitor. The data highlights GM's superior ability to generate cash and manage its balance sheet.
- Free Cash Flow (LTM): GM stands at $14.4 billion, nearly double Ford's $7.3 billion.
- Profitability: GM's gross margin is 10.2% versus Ford's 7.1%. GM also posted a positive net margin of 1.1% over the last twelve months, while Ford's was -3.9%.
- Return on Equity (ROE): GM recorded a positive ROE of 2.9%, starkly contrasting with Ford's -18.3%, which indicates a destruction of shareholder value.
- Leverage: Ford's debt-to-equity ratio of 450.6% is more than double GM's 207.7%, suggesting a higher risk profile.
Contrasting Performance and Outlook
Recent performance and forward-looking guidance further separate the two automakers. GM recently reported a Q2 2026 earnings per share beat and raised its full-year adjusted EBIT guidance for the second time to a range of $14.0 billion to $16.0 billion.
 Ad
In contrast, Ford reported a significant net loss of -$8.18 billion for fiscal year 2025. The company's valuation also raises questions, with an EV/EBITDA multiple of 25.5x, more than twice GM’s 10.8x. This suggests the market may be pricing in a significant recovery or misjudging the inherent risks.
Valuation and Investor Considerations
Despite GM's operational strengths, valuation models suggest investors should proceed with caution. Fair value estimates from InvestingPro indicate potential downside of roughly 23% for both stocks from their current prices, a factor to consider after GM's stock surged 67.7% over the past year.
For income-focused investors, Ford’s 4.2% dividend yield may seem compelling compared to GM's 0.8%. However, the sustainability of Ford's dividend is a key question, given its recent net loss. Analysts, on average, see more upside for GM's stock at +15.2%, compared to +8.6% for Ford.
Read next
More on Stocks
FTC Orders Walmart, Uber, Delta to Disclose Data on Personalized Pricing
The U.S. Federal Trade Commission is demanding nine major companies, including leading retail, travel, and gig economy firms, to provide information on how they use consumer data for setting individual prices and wages.

Google Launches Gemini 4 Carbon AI Model to Bolster Cybersecurity Capabilities
Alphabet's Google has unveiled Gemini 4 Carbon, its latest AI model specifically designed for advanced cybersecurity tasks like vulnerability detection and secure code generation. The launch escalates competition with rivals OpenAI and Anthropic in the enterprise AI market.

Oracle Shares Surge After Unveiling $225 Billion Revenue Target for 2030
Oracle stock rose sharply after the company presented a long-term financial outlook targeting at least $225 billion in annual revenue by fiscal 2030, driven by its expanding AI infrastructure business.

DOJ Scrutinizes Nvidia's $12.9B Hugging Face Deal Amid Broader Antitrust Probe, Sources Say
The U.S. Department of Justice is reportedly examining Nvidia's planned $12.93 billion acquisition of AI platform Hugging Face as part of a wider, ongoing antitrust investigation into the chipmaker's market conduct.