
Story
German DAX Stalls at Key Resistance as Bear Flag Pattern Signals Further Downside Risk

Germany's benchmark DAX index is exhibiting signs of weakness as it struggles beneath a heavy layer of technical resistance, with chart patterns suggesting a high probability of a continued downtrend. Technical analysis on Monday shows the index trapped below the Ichimoku cloud, a key momentum and trend indicator, while a bearish chart pattern takes shape.
A Ceiling of Resistance
The primary challenge for the DAX is a dense zone of overhead resistance. The price is currently capped below several widely-watched long-term trend indicators, signaling that sellers are maintaining control.
- Ichimoku Cloud: This indicator is providing a thick resistance band between EUR 25,393 and EUR 25,476.
- Moving Averages: The 200-period Simple Moving Average (SMA), a critical gauge of the long-term trend, is also acting as a ceiling at EUR 25,608.8.
Price action remaining below this confluence of indicators suggests that attempted rallies are likely to be met with selling pressure. A decisive break above this area would be required to invalidate the current bearish outlook.
Bear Flag and Downside Targets
 Ad
Adding to the bearish case is the formation of a bear flag pattern, which technical analysts view as a continuation signal that typically occurs after a significant price decline. The pattern suggests a period of brief consolidation before the next leg down.
A sustained close below the key support level at EUR 25,272, which aligns with a 61.8% Fibonacci retracement level, could act as the trigger for further losses. A breakdown from this level would expose the recent swing low of EUR 24,925. A more extended bearish target sits at the 127.2% Fibonacci extension level of EUR 24,678.
Conflicting Signals Warrant Caution
While the broader picture appears bearish, some indicators signal potential for short-term stabilization or indecision. The appearance of a Doji candlestick suggests a state of equilibrium between buyers and sellers.
Furthermore, the Money Flow Index (MFI) has fallen to an oversold reading of 17.14, which can sometimes precede a price bounce as selling pressure becomes exhausted. However, this is contrasted by the MACD momentum indicator, which remains firmly in bearish territory, confirming that downward momentum is still active.
Read next
More on Stocks
Investing.com Announces Subscription Discount Amid Peak Earnings Week
Financial markets data provider Investing.com has launched a promotional campaign for its 'InvestingPro' subscription service, coinciding with a week in which 179 S&P 500 companies are scheduled to release quarterly results.
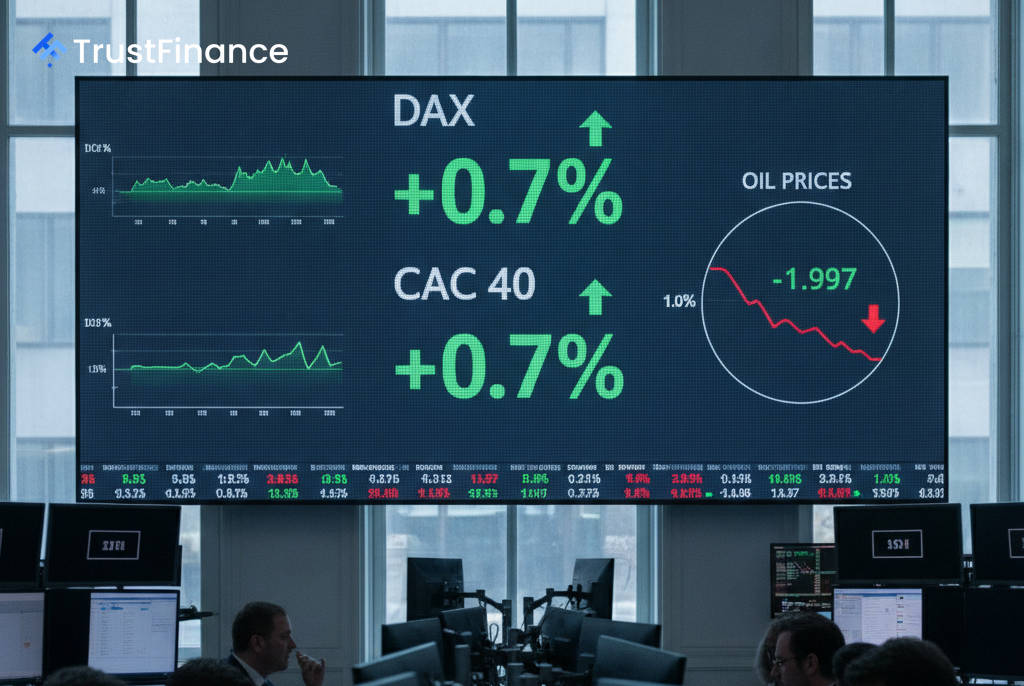
European Stocks Steady as Oil Eases, Markets Brace for Central Banks and Tech Earnings
European shares edged higher as a retreat in oil prices provided some relief, but gains were capped by investor caution ahead of key central bank policy meetings and a slate of major U.S. technology earnings.

Plus500 Shares Rally After Fintech Firm Boosts Full-Year Outlook
London-listed shares of Plus500 jumped after the global fintech group reported strong third-quarter growth in revenue and customer metrics, prompting an upgrade to its full-year financial guidance.

FTSE 100 Gains as Mining Stocks Rally on Higher Gold Prices
London's blue-chip index rose Monday, supported by strength in the mining sector as gold prices advanced. A simultaneous pullback in crude oil prices also contributed to positive investor sentiment ahead of the UK's midweek budget announcement.