
Story
Alphabet Stock Stalls at $341, Faces Key Technical Test at $347 Resistance

Summary
Alphabet's Class C shares are consolidating in a narrow range, caught between key technical support and a significant Fibonacci resistance level around $347. Traders are watching for a decisive volume-backed move to signal the stock's next direction.
Alphabet's Class C stock (GOOG) is trading in a tight consolidation pattern, hovering around $341.63 in what technical analysts describe as a "chop zone." The stock faces a critical inflection point, positioned between established support levels and a formidable resistance barrier that could dictate its next major move.
A Technical Standoff
According to a technical analysis from Investing.com, the stock is currently in a precarious balance. While it holds above key short-term support indicators, it has so far failed to breach a significant ceiling.
- Support Levels: The price remains above the 50-period moving average at $338.61 and the top of the Ichimoku Cloud indicator at $340.16, which are viewed as positive signs by bulls.
- Key Resistance: The primary obstacle is the 38.2% Fibonacci retracement level at $346.86. A failure to close decisively above this price could halt the recent upward momentum.
The zone between $340 and $346 is considered a high-risk area for traders, prone to unpredictable price swings, or "whipsaw" moves, until a clear trend emerges.
Bull and Bear Scenarios
 Ad
AdThe current price action presents conflicting signals, creating distinct scenarios for both bullish and bearish investors. Bulls point to a recent bullish MACD crossover and increasing volume as signs of strength. A sustained close above the $347 resistance level could open the door for a rally toward the 200-period simple moving average (SMA) at $357.05.
Conversely, bears highlight the stock's position below that long-term 200 SMA, suggesting the broader trend remains negative. A weak Average Directional Index (ADX) reading of 16.77 indicates a lack of strong trend, warning that any breakout attempt might fail. A rejection at the $346.86 resistance or a break below support at $338 could trigger a sell-off toward the $325 level.
What to Watch Next
Market participants are closely monitoring trading volume for confirmation of the stock's next move. A breakout above resistance on low volume could signal a "bull trap," a false signal that quickly reverses. A decisive move in either direction must be accompanied by a sustained increase in volume to be considered credible.
Analysts caution that until the stock exits the current $340-$346 range, the path of least resistance is sideways. The outcome of this technical battle will likely set the tone for Alphabet's stock performance in the near term.
Read next
More on Stocks
Orion180 Prices IPO at $12 Per Share, Targeting $240 Million Raise
Florida-based insurer Orion180 Insurance Group Inc. has priced its initial public offering of 20 million shares at $12.00 each, aiming to raise $240 million ahead of its debut on the Nasdaq.

Nucor Stock Slides After Q3 Earnings Guidance Misses Analyst Forecasts
Nucor Corporation (NUE) shares fell after the company projected third-quarter earnings of $5.55 to $5.65 per share, below the Wall Street consensus of $5.99, citing the absence of significant one-time gains from the prior quarter.
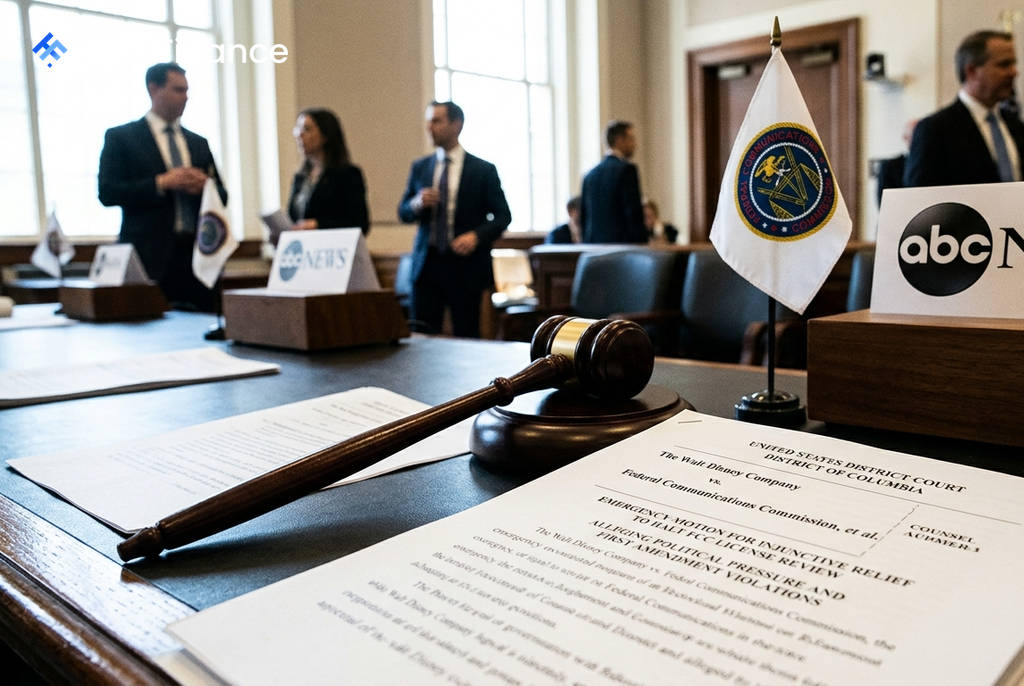
Disney Asks Court to Halt FCC License Review, Alleges Political Pressure From Trump
The Walt Disney Company has filed a legal challenge to stop the Federal Communications Commission from conducting an early review of its ABC station licenses, claiming the regulator is acting on President Trump's directives.

Starbucks Settles Florida Lawsuit Over Diversity Policies for $1 Million
The coffee giant has agreed to settle a lawsuit with Florida's attorney general, pledging to avoid race- or sex-based quotas in its employment practices and pay $1 million to cover the state's litigation costs.