
Story
Nasdaq 100 Trades in Tight Range as Technical Indicators Signal Potential Breakout
Summary
The Nasdaq 100 index is trading within a narrow range, caught between key technical support and resistance levels. Shrinking volatility and a recent doji candlestick pattern suggest a significant price move may be imminent.
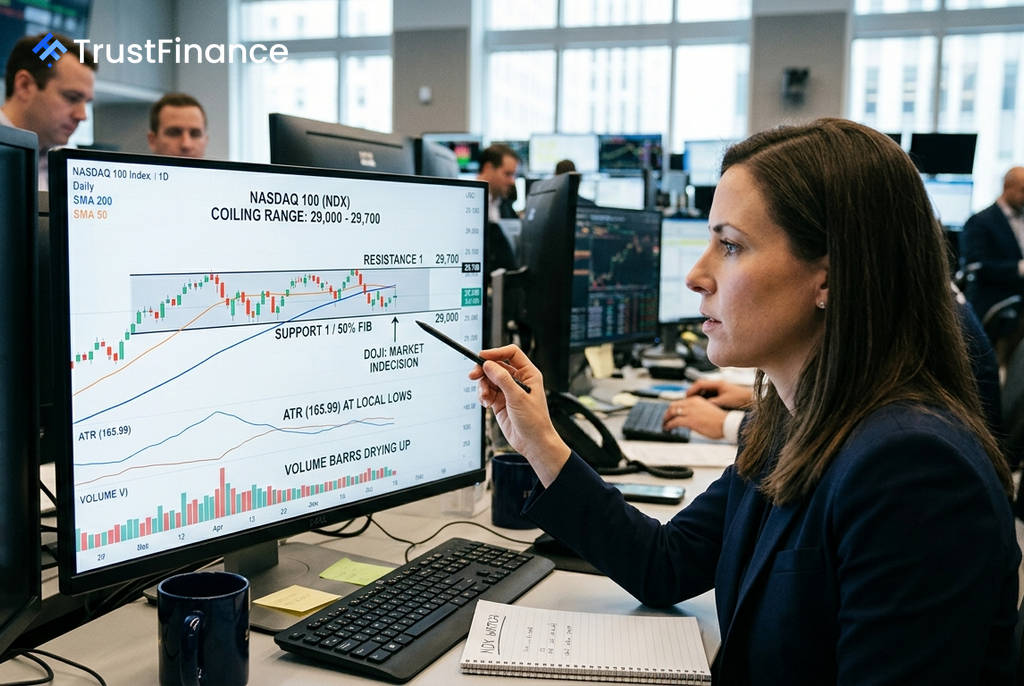
The Nasdaq 100 index is locked in a tight consolidation pattern, with technical indicators pointing to a significant price move on the horizon as market indecision intensifies. According to an analysis by Investing.com, the tech-heavy index was trading around 29,354.5, caught between well-defined support and resistance levels.
A Battle Between Bulls and Bears
The index has been trading in a textbook rectangle pattern, with support holding near the 29,000 mark and resistance capping gains around 29,700. A recent doji candlestick pattern at 29,298 underscores the current market equilibrium, where neither buyers nor sellers have gained decisive control, according to the analysis.
Conflicting technical signals highlight the market's indecision. Bullish sentiment is supported by the index remaining above its long-term 200-period moving average of 29,277. However, bears point to the price being stuck below key short-term resistance, including the 50-period simple moving average (SMA) at 29,394.
Key Technical Levels in Focus
Market participants are closely monitoring several critical technical levels that could determine the index's next direction. A breakout from the current range would likely be triggered by a sustained move past one of these zones.
 Ad
Ad- Primary Support: The psychological level of 29,000 forms the base of the current trading range, reinforced by the 50% Fibonacci retracement level at 29,088.
- Immediate Resistance: The 50-period SMA at 29,394 and the Ichimoku Kijun line at 29,403 present the first hurdles for buyers.
- Primary Resistance: A breakout above the SuperTrend indicator at 29,614 and the range top at 29,700 would be required to signal a bullish continuation.
Shrinking Volatility Signals Coiled Market
The period of consolidation is accompanied by declining trading volume and shrinking volatility, a classic setup that often precedes a major price expansion. The Average True Range (ATR), a measure of volatility, has fallen to 165.99, or just 0.57%, near recent lows, as noted by Investing.com.
This "coiling" action suggests that energy is building for a decisive move. A sustained close above the resistance zone or below the support area, especially if accompanied by a surge in volume, will likely dictate the Nasdaq 100's trend in the near term.
Read next
More on Stocks
U.S. Stock Futures Rebound as Markets Digest Hawkish Fed Rate Hike
U.S. stock futures rose in overnight trading, recovering from a sell-off triggered by the Federal Reserve's first interest rate hike in three years. Falling oil prices and positive corporate news helped lift market sentiment.

Holtec Suspends $900 Million IPO Amid Challenging Market Conditions
Nuclear services company Holtec Nuclear Corp. has postponed its U.S. initial public offering, which aimed to raise as much as $900 million, citing unfavorable market conditions and weak performance from recently listed peers in the sector.

Snap Stock Climbs on Enterprise Push for New Specs AR Glasses
Shares of Snap Inc. gained in after-hours trading after the company unveiled its new $2,195 Specs AR glasses and announced key enterprise partnerships with Salesforce, Nvidia, and AWS.

Gold Prices Fall as Hawkish Fed Outlook Boosts US Dollar
Gold prices declined after the Federal Reserve raised interest rates by 25 basis points and signaled further tightening, strengthening the U.S. dollar and increasing the opportunity cost of holding the non-yielding metal.