
Story
WTI Crude Oil Flashes Bearish Technical Signal, Pointing to Potential Pullback
Summary
West Texas Intermediate crude futures are showing signs of weakening upward momentum, with a key technical indicator on the 5-hour chart forming a bearish crossover. This signal suggests a potential for a short-term price correction after a recent strong rally.
West Texas Intermediate (WTI) crude oil futures are signaling a potential short-term reversal after a period of strong gains. A bearish crossover in the Moving Average Convergence Divergence (MACD) indicator on the 5-hour chart suggests that upward momentum is fading, raising the risk for long positions.
Bearish Momentum Signals Emerge
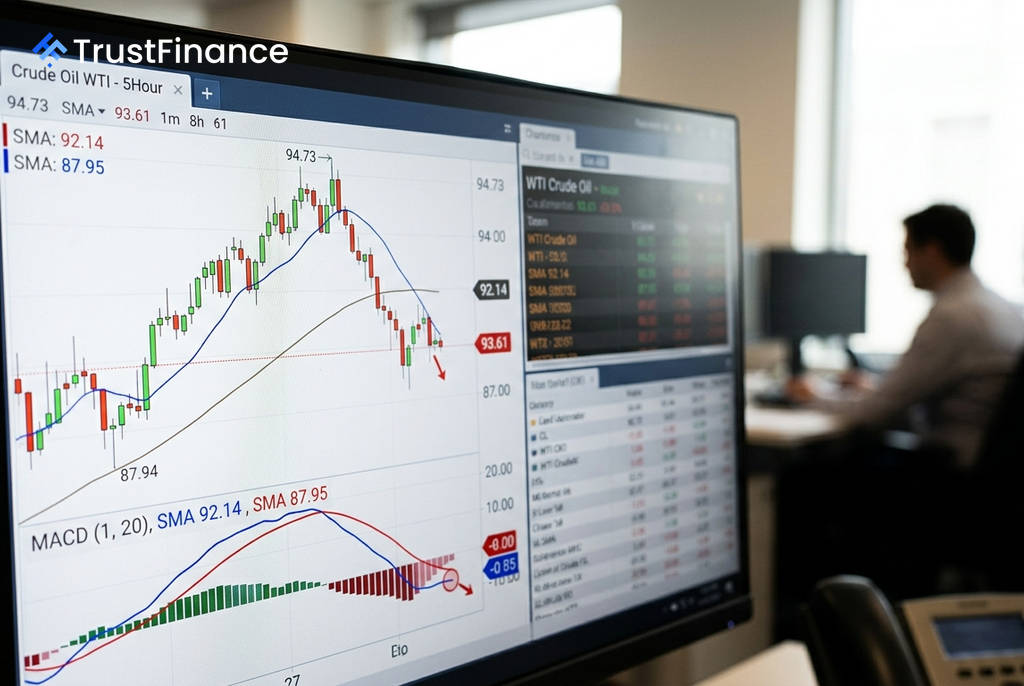
The primary warning sign for traders is a bearish MACD crossover, where the indicator's main line (at 1.43) has crossed below its signal line (1.48). This technical event is often interpreted as a signal that a security's price momentum is shifting to the downside. At the time of the signal, WTI was trading around $93.61.
Several other factors support the case for a potential pullback:
- Price Rejection: The chart shows a long upper wick at the recent high of $94.73, indicating that sellers stepped in to push the price down from its peak.
- Money Flow Index (MFI): The MFI has fallen to 15.12, a level considered to be in oversold territory. This suggests that profit-taking pressure is building at these elevated prices.
- Overextension: The current price is approximately 11.95% above its 200-period simple moving average (SMA), which could point to a need for the price to revert closer to its long-term mean.
Broader Uptrend Remains Intact
 Ad
AdDespite the short-term warning signs, the broader trend for WTI crude remains bullish. The price continues to trade above all key simple moving averages, which are often viewed as support levels.
The key SMAs are currently located at $92.14 (20-period), $87.95 (50-period), and $83.62 (200-period). As long as the price holds above these levels, particularly the 20-period SMA, the underlying uptrend is not considered broken.
Key Levels to Watch
For market participants, the price action around two key levels will be critical in determining the next directional move. The immediate support level is the 20-period SMA at $92.14. A 5-hour chart closing price below this mark could trigger a wave of stop-loss orders from long positions and open the door for a deeper correction.
Conversely, the key resistance is the recent high of $94.73. A decisive breakout above this level would invalidate the bearish MACD signal and could force short-sellers to cover their positions, potentially fueling a rally toward the $100 psychological benchmark.
Read next
More on Commodities
Oil Prices Edge Lower as Middle East Supply Concerns Ease
Crude oil benchmarks fell slightly as reports of Saudi Arabia rerouting shipments and U.S.-Houthi dialogue offset a hawkish Federal Reserve and lingering regional tensions.

US Eases Hours-of-Service Rules for Fuel Truckers Amid Supply Concerns
The Department of Transportation has issued a 90-day waiver allowing fuel truck drivers to work longer hours, a response to record diesel prices and fears of potential supply chain disruptions.

Oil Prices Fall as Saudi Arabia Reroutes Crude, Easing Supply Fears
Oil prices continued their decline after reports that Saudi Arabia is offering additional crude cargoes via Oman, mitigating fears of supply disruptions from recent pipeline attacks. A smaller-than-expected draw in U.S. inventories also weighed on the market.

European Gas Prices Surge 5% as JERA CEO Warns of Critically Low Reserves
European and UK natural gas prices jumped nearly 5% on Monday, hitting multi-year highs amid worsening Mideast shipping disruptions and a stark warning from a major LNG buyer about critically low storage levels.