
Story
WTI Crude Oil Falters Near $103 as Bearish 'Double Top' Pattern Emerges
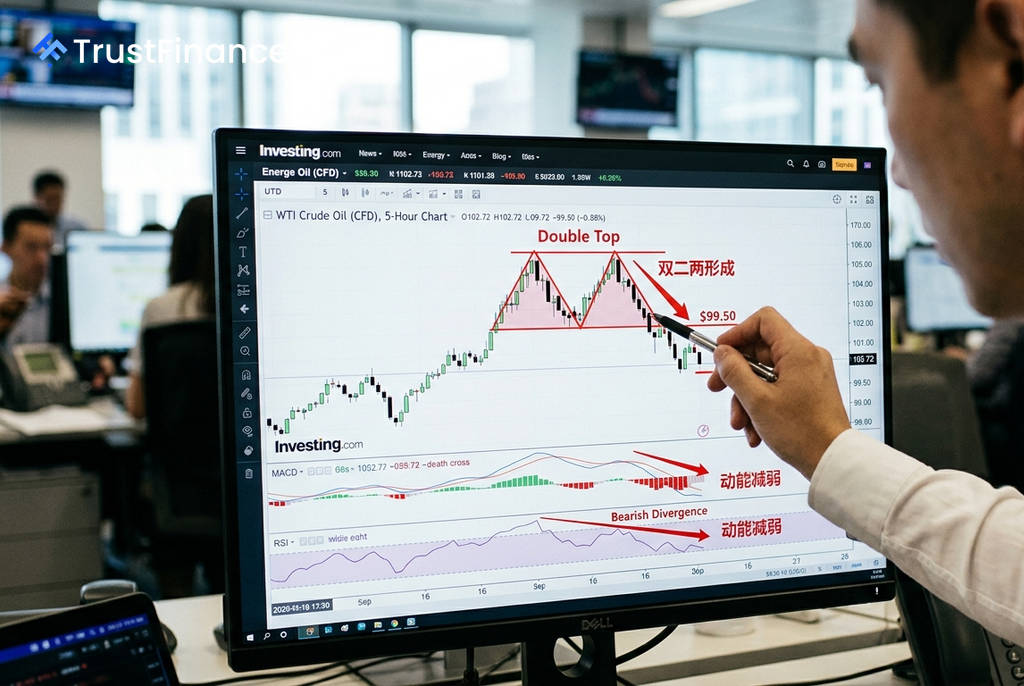
West Texas Intermediate (WTI) crude oil has pulled back after reaching a high of $102.72, with technical charts now signaling an increased risk of a near-term correction. The formation of a potential bearish "double top" pattern suggests that the recent powerful rally may be losing steam, putting a key support level in the spotlight.
Technical Red Flags Emerge
Following a parabolic advance since mid-June, the price structure for WTI crude now appears top-heavy. A potential double top is taking shape near the $106.75 resistance level, a classic technical pattern that often precedes a trend reversal. A decisive break below the $99.50 support level would help confirm this bearish pattern, potentially triggering a more significant sell-off.
Several key indicators are corroborating the warning signs of waning bullish momentum:
- MACD: The Moving Average Convergence Divergence indicator has registered a bearish crossover, with its main line dipping below the signal line. A bearish divergence, where price hits a new high but the indicator does not, is also apparent.
- RSI: The Relative Strength Index has fallen from overbought territory to 57.09, indicating that buying pressure is diminishing.
- Volume: Trading volume has been declining as prices have risen, a "volume-price divergence" that suggests conviction behind the uptrend is weakening.
Key Price Levels to Watch
For market participants, several price levels are critical in determining the next directional move. The primary battleground for bulls and bears is forming around the $99.50 support, a confluence of the SuperTrend indicator and a 50% Fibonacci retracement level.
 Ad
A breakdown of key support and resistance is as follows:
- Immediate Resistance: $104.00 - $105.50
- Major Resistance / Double Top Peak: $106.75
- Critical Support: $99.50
- Further Support Levels: $97.30 (near the 50-day simple moving average) and $93.50.
Market Outlook
While the longer-term uptrend remains technically intact with prices above the 50-day moving average (currently at $97.29), the short-term outlook has become more precarious. The current price is over 18% above its 200-day moving average, a sign that the market may be overextended and due for a consolidation or correction.
Investors will be closely watching whether the $99.50 support holds. A failure to defend this level could shift market control to sellers, confirming the topping pattern and signaling the end of the recent strong upward phase.
Read next
More on Commodities
U.S. Crude Inventories Post Surprise Draw While Gasoline Stocks Swell, EIA Reports
U.S. crude oil stockpiles fell unexpectedly last week, driven by a surge in exports, while gasoline inventories saw a significant build amid weakening demand, according to the latest EIA data.

UBS Raises Year-End Brent Forecast to $110 on Middle East Supply Risks
UBS has increased its year-end forecast for Brent crude to $110 per barrel, citing escalating supply risks in the Middle East, declining global inventories, and record-high freight costs.
Iran Dismisses Latest Qatari Peace Proposal as 'Unacceptable'
A senior Iranian official has rejected the latest Qatari-mediated draft deal to end the eight-month war, calling the ideas 'unacceptable' and signaling a continued diplomatic impasse. The news comes amid rising oil prices following attacks on Saudi energy infrastructure.

Argentina Poised to Gain EU Soymeal Market Share as Deforestation Rules Hit Brazil
Argentina's soybean industry is preparing to capture a larger share of the European Union's soymeal market as new EU anti-deforestation rules are expected to disrupt exports from rival Brazil.