
Story
Silver Stalls Below $62 as Technical Indicators Signal Bearish Pressure
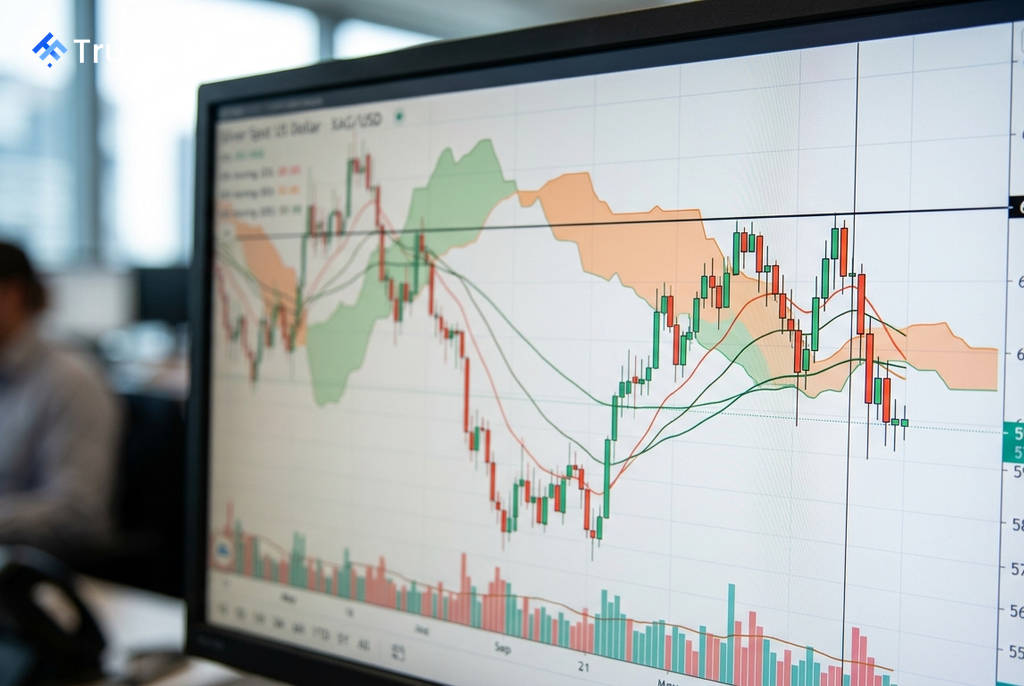
Silver prices are facing significant headwinds, consolidating below a critical technical resistance zone as multiple indicators suggest a bearish outlook. The precious metal was trading around $59.96 on the 4-hour chart, struggling to overcome a cluster of resistance levels, according to a technical analysis by Investing.com.
Key Resistance Holds Firm
Silver's recent rebound attempt has stalled at a confluence of resistance levels between $60.20 and $61.85. This area represents a significant technical barrier for buyers, with a failure to break above it suggesting that sellers currently maintain control of the market's short-term direction.
The analysis highlights several key components creating this resistance wall:
- The 38.2% Fibonacci retracement level is located at $61.84.
- The 50-period moving average sits at $60.21.
- The Ichimoku Kumo Cloud, another key indicator, provides resistance in the $60.17–$60.40 range.
Technical Indicators Signal Weakness
 Ad
Beyond the immediate price barriers, other technical signals reinforce the bearish sentiment. The price remains well below the long-term 200-period moving average of $66.88, confirming a broader downtrend is in place.
While the Moving Average Convergence Divergence (MACD) indicator has shown a bullish crossover, its position below the zero line suggests the upward momentum is weak. Furthermore, the analysis noted that declining trading volume during the recent price bounce indicates a lack of strong conviction from buyers.
Potential Market Scenarios
Based on this technical setup, the analysis outlines a high probability of a downward move if the resistance holds. A rejection from current levels could see silver prices target lower support zones, with potential targets identified at $58.08, $57.60, and $55.75.
Conversely, the bearish case would be invalidated if buyers manage to push the price decisively above the resistance cluster. A strong 4-hour candle close above $61.85 would signal a potential shift in momentum. The analysis cautions that the $59.10–$60.20 range is likely to be choppy and offers low-conviction trading conditions.