
Story
Silver Price Tests Critical 200-Period Moving Average Amid Strong Bearish Momentum

Silver prices are under significant pressure, trading within a strong downward channel on the 5-hour chart and approaching a critical technical support level that could determine the metal's short-term direction.
Key Technical Levels in Focus
Silver is currently trading around $64.17 and nearing the pivotal 200-period moving average, located at $63.53. This moving average is a widely watched indicator, often acting as a significant line of defense for bulls in a downtrend.
A decisive break below this support could open the door for a deeper sell-off. Technical analysis suggests the next major target for bears would be $61.27, a level that corresponds to the 61.8% Fibonacci retracement. Meanwhile, any near-term rally would face stiff resistance from the 20- and 50-period moving averages, both clustered in the $66.80–$66.90 range.
Bearish Indicators Dominate
The current selling pressure is reinforced by several technical signals. The downtrend follows the confirmation of a double-top pattern near $71.40, a classic bearish reversal formation that suggests the prior uptrend has ended.
 Ad
Further supporting the bearish outlook, the Moving Average Convergence Divergence (MACD) indicator has registered a bearish crossover and shows accelerating negative momentum. While the Relative Strength Index (RSI) at 36.53 is approaching oversold territory, which can sometimes precede a price bounce, the dominant trend remains firmly negative.
Market Implications
The price zone between $63.20 and $63.50 represents a critical battleground for traders, as it marks a confluence of the 200-period moving average and a key Fibonacci level. A failure to hold this support would likely be interpreted by market participants as a confirmation of a longer-term top, potentially leading to further declines toward $61.27 or even the prior low of $55.00.
For a bullish reversal to gain credibility, the price would need to decisively reclaim the resistance area around $66.90. According to the technical setup, any rally that fails to overcome this level could be viewed as a temporary retracement, or a "bull trap," within the broader downtrend.
Read next
More on Commodities
U.S. Crude Inventories Post Surprise Draw While Gasoline Stocks Swell, EIA Reports
U.S. crude oil stockpiles fell unexpectedly last week, driven by a surge in exports, while gasoline inventories saw a significant build amid weakening demand, according to the latest EIA data.

UBS Raises Year-End Brent Forecast to $110 on Middle East Supply Risks
UBS has increased its year-end forecast for Brent crude to $110 per barrel, citing escalating supply risks in the Middle East, declining global inventories, and record-high freight costs.
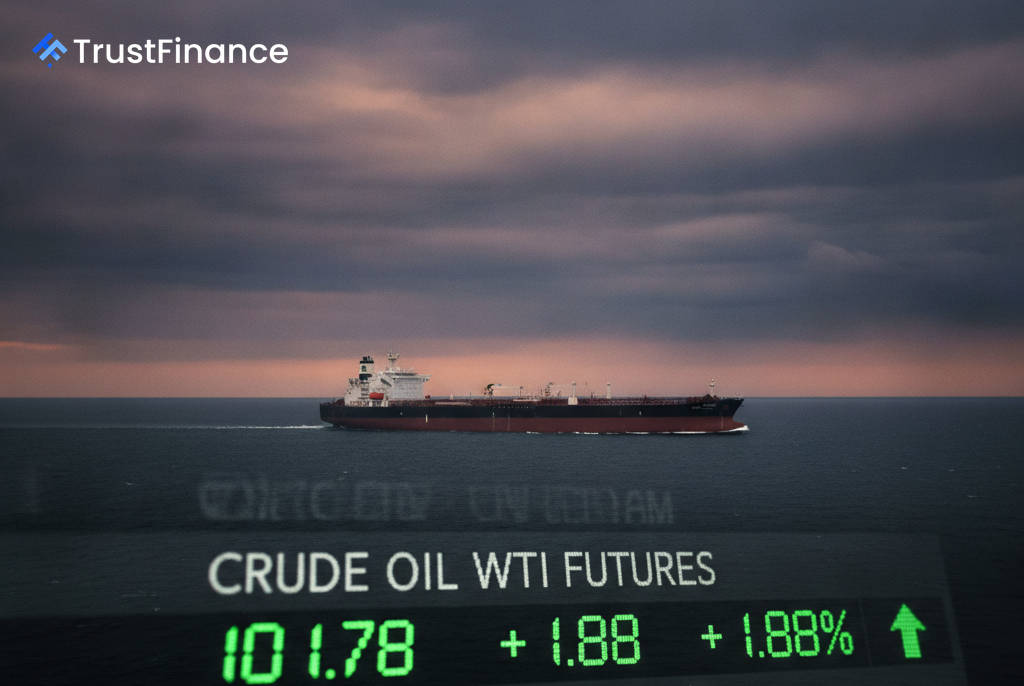
Iran Dismisses Latest Qatari Peace Proposal as 'Unacceptable'
A senior Iranian official has rejected the latest Qatari-mediated draft deal to end the eight-month war, calling the ideas 'unacceptable' and signaling a continued diplomatic impasse. The news comes amid rising oil prices following attacks on Saudi energy infrastructure.

Argentina Poised to Gain EU Soymeal Market Share as Deforestation Rules Hit Brazil
Argentina's soybean industry is preparing to capture a larger share of the European Union's soymeal market as new EU anti-deforestation rules are expected to disrupt exports from rival Brazil.