
Story
Silver Price Rejects Key Resistance, Technical Indicators Signal Potential Weakness
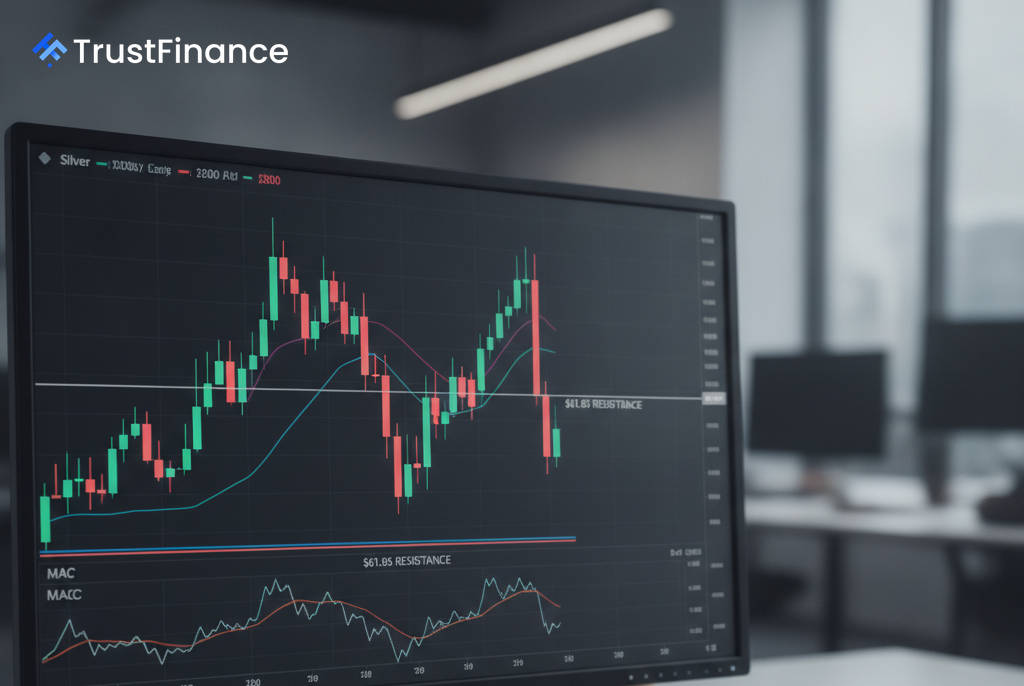
Silver's price momentum has faltered after hitting a significant wall of technical resistance, with the precious metal currently trading around $59.96. The recent bounce failed to break through a key zone between $60.20 and $61.85, signaling that sellers may be reasserting control.
Resistance Halts Rally
The rejection occurred at a confluence of important technical levels on the 4-hour chart, according to an analysis by Investing.com. This resistance cluster includes the 38.2% Fibonacci retracement level at $61.84, a widely watched indicator for potential price reversals.
The price also remains below both its 50-period moving average of $60.21 and its 200-period moving average of $66.88, which analysts typically interpret as confirmation of a bearish trend over the short and long term, respectively.
Bearish Indicators Predominate
Several other technical indicators reinforce the bearish outlook for silver. The attempted rally was accompanied by declining trading volume, suggesting a lack of strong conviction from buyers. Furthermore, the price is trading below the Ichimoku Cloud, another indicator that points to a strong bearish bias.
 Ad
While the Moving Average Convergence Divergence (MACD) indicator showed a minor bullish crossover, its position below the zero line diminishes the signal's strength. According to the source analysis, the combination of clustered resistance and weak buying pressure creates a classic setup for a potential move lower.
Market Outlook and Key Levels
Following the failure at resistance, traders are now watching to see if the price breaks below its current consolidation range. The technical setup suggests potential downside targets at $58.08 and $57.60 if the selling pressure accelerates.
The bearish case would be challenged if buyers can push the price decisively above the resistance zone. A strong 4-hour chart closing price above $61.85 would be required to invalidate the current downward pressure and signal a potential shift in market sentiment.