
Story
Silver Price Coils Below Key $61.85 Resistance, Signaling Potential Volatility
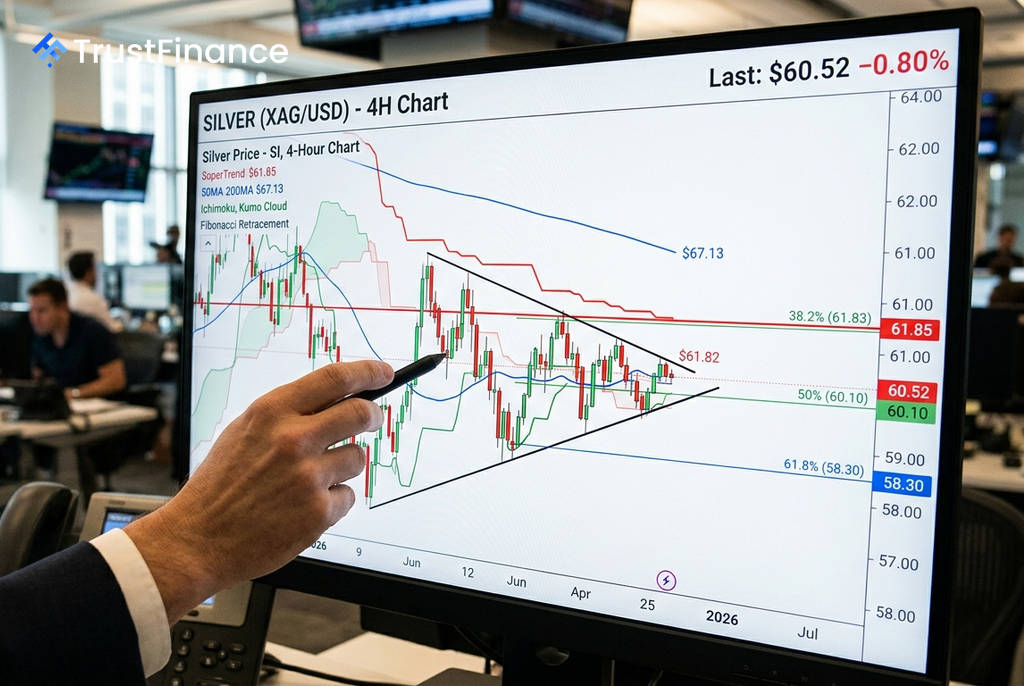
Silver prices are consolidating in a narrow range around $60.52, caught between a formidable technical resistance barrier and nearby support, setting the stage for a potentially volatile breakout. According to a technical analysis by Investing.com, the precious metal is in a high-stakes battle between short-term buying pressure and a dominant long-term bearish trend.
Key Technical Levels in Focus
A critical resistance zone has formed between $61.83 and $61.85, a level that represents a confluence of the SuperTrend indicator and the 38.2% Fibonacci retracement. In technical analysis, such a convergence of indicators often creates a significant hurdle for price advances.
Below the current price, key support is identified near the $58.00 level. This compression of price between well-defined technical boundaries suggests that energy is building for a directional move, with market participants watching for a decisive break.
Conflicting Signals Create Uncertainty
The current market structure presents a classic tug-of-war between opposing forces. On the bullish side, silver has been establishing a pattern of higher lows since late June, and a recent bullish engulfing candle on the four-hour chart indicates persistent short-term buying interest.
 Ad
However, the broader trend remains bearish. The price is trading nearly 10% below its 200-period moving average of $67.13, a key long-term trend indicator. Analysts also note that declining volume during the recent price rally suggests a lack of strong conviction among buyers, increasing the risk of a "bull trap" where a brief move above resistance quickly fails.
Market Outlook
The analysis highlights a "chop zone" between $59.50 and $61.00, an area where price action is likely to be erratic and lack clear direction. Investors are closely watching for a breakout confirmed by an increase in trading volume to signal the next trend.
A sustained close above the $61.85 resistance could open the door for further gains, while a break below key support could see bearish momentum accelerate. The Average True Range (ATR), a measure of volatility, suggests that the eventual move, once it occurs, could be swift.