
Story
Samsung SDI Stock Enters Consolidation as Bearish Technical Signals Emerge
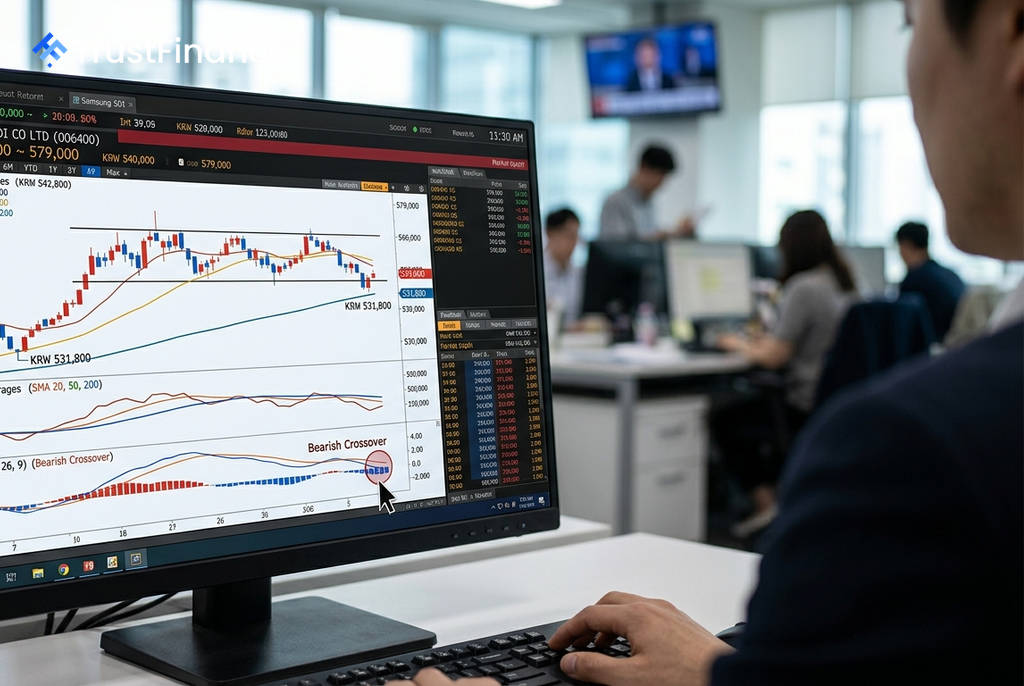
Samsung SDI (006400.KS) has entered a period of consolidation, with its stock price trapped in a tight trading range as conflicting technical signals create uncertainty among investors. The short-term outlook is facing headwinds, even as the battery maker's longer-term upward trend remains technically intact.
A Battle of Indicators
Analysis of the 5-hour chart shows the stock is currently range-bound between KRW 540,000 and KRW 579,000. Several short-term indicators suggest potential for a downward move.
- A MACD "death cross" has formed, a bearish signal indicating that downward momentum may be accelerating.
- The Money Flow Index (MFI) is at 81.08, a level often considered overbought, suggesting buying pressure could be exhausted.
- A bearish "engulfing" candlestick pattern has appeared near the KRW 600,000 resistance level, accompanied by declining trading volume, which can signal a loss of buyer conviction.
Long-Term Support Holds Firm
Despite the short-term warnings, longer-term metrics still offer support for a bullish case. The stock's price remains above its 200-period Simple Moving Average (SMA), a key long-term trend indicator currently at KRW 531,808.
 Ad
Furthermore, the price is holding above the SuperTrend indicator's support line at KRW 524,715. A high Average Directional Index (ADX) reading of 32.56 confirms that the preceding trend was strong, though the current sideways movement indicates a pause in that momentum.
Key Levels to Watch
For investors, the current price action within the Ichimoku Cloud indicator underscores the market's indecision. A breakout from the current range is needed to establish a clear direction.
Key resistance is located at the top of the range near KRW 579,000, with a more significant psychological and technical barrier at KRW 600,000. A sustained move above this level could re-confirm the longer-term uptrend. Conversely, critical support lies at the SMA 200 (KRW 531,808) and a 38.2% Fibonacci retracement level at KRW 501,000. A break below these supports could signal that sellers are taking control.
Read next
More on Stocks
FTC Orders Walmart, Uber, Delta to Disclose Data on Personalized Pricing
The U.S. Federal Trade Commission is demanding nine major companies, including leading retail, travel, and gig economy firms, to provide information on how they use consumer data for setting individual prices and wages.

Google Launches Gemini 4 Carbon AI Model to Bolster Cybersecurity Capabilities
Alphabet's Google has unveiled Gemini 4 Carbon, its latest AI model specifically designed for advanced cybersecurity tasks like vulnerability detection and secure code generation. The launch escalates competition with rivals OpenAI and Anthropic in the enterprise AI market.

Oracle Shares Surge After Unveiling $225 Billion Revenue Target for 2030
Oracle stock rose sharply after the company presented a long-term financial outlook targeting at least $225 billion in annual revenue by fiscal 2030, driven by its expanding AI infrastructure business.
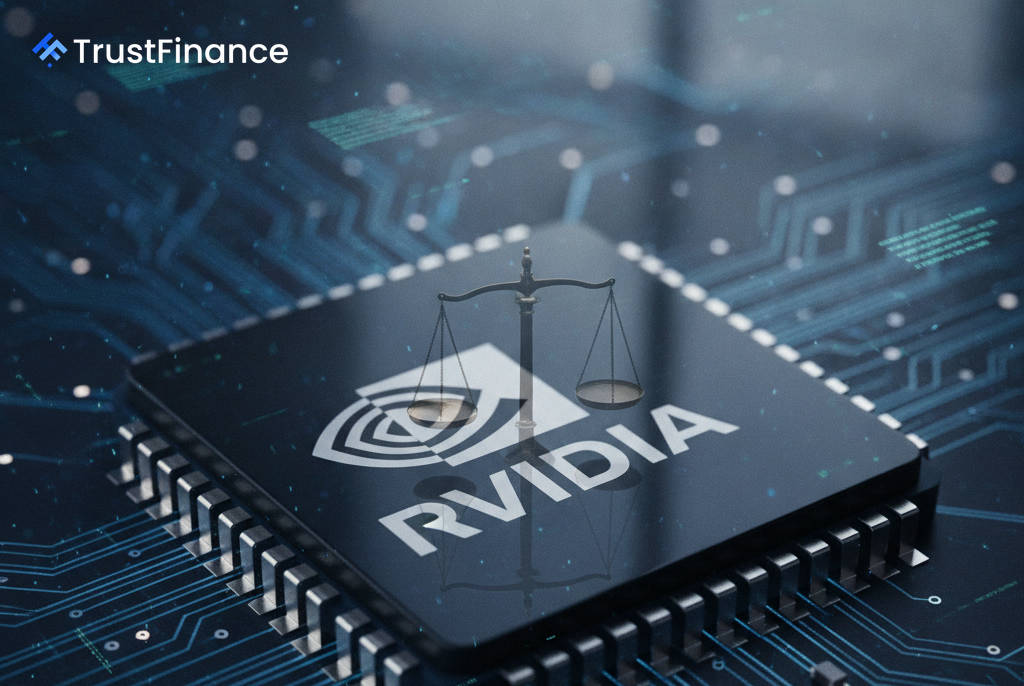
DOJ Scrutinizes Nvidia's $12.9B Hugging Face Deal Amid Broader Antitrust Probe, Sources Say
The U.S. Department of Justice is reportedly examining Nvidia's planned $12.93 billion acquisition of AI platform Hugging Face as part of a wider, ongoing antitrust investigation into the chipmaker's market conduct.