
Story
Natural Gas Price Stalls at Key $3.05 Resistance Zone
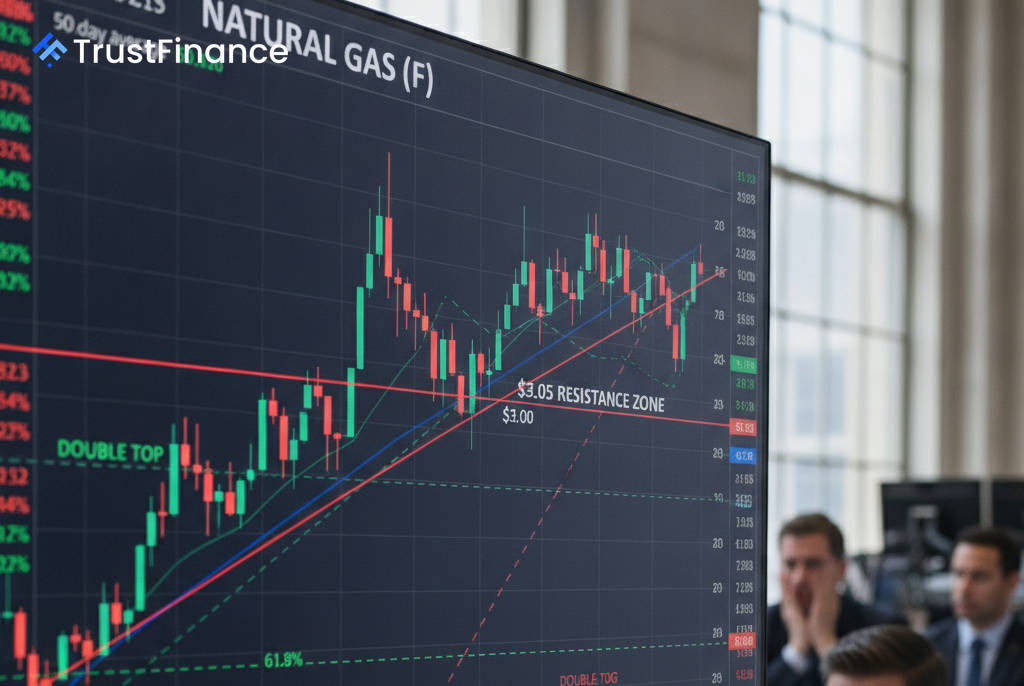
Natural gas futures are facing a critical test as the price consolidates around a dense resistance zone of $3.00 to $3.05. This area represents a major technical hurdle where several key indicators are converging, creating significant uncertainty about the commodity's next directional move.
A Confluence of Resistance
The current price point is significant because it marks the intersection of multiple widely-watched technical levels. A failure to break decisively above this zone could be interpreted as a bearish signal, potentially leading to a resumption of the prior downtrend.
Key indicators forming this resistance include:
- The 50-day Simple Moving Average (SMA), currently at $3.016.
- The 200-day SMA, which adds to the resistance in this vicinity.
- The 61.8% Fibonacci retracement level calculated at $3.059, a critical level derived from the prior swing between a low of $2.616 and a high of $3.334.
Bullish and Bearish Signals Clash
 Ad
Technical indicators are providing conflicting signals, highlighting the market's current state of indecision. While short-term momentum appears bullish, it is running directly into strong medium-term resistance.
A Doji candlestick pattern formed at $3.007 on October 27, which typically signals indecision or a potential reversal point. Bullish arguments point to the price holding above its 20-day SMA ($2.879) and a recent MACD indicator crossover, suggesting upward momentum. However, bears note the formation of a potential bear flag pattern and the price's struggle to overcome the 50-day SMA.
Key Price Levels to Watch
Traders are closely monitoring the market's reaction to this pivotal zone. A sustained breakout above the $3.07 level would invalidate the immediate bearish pressure and could open the path toward higher resistance targets at $3.18 and the recent macro high of $3.33.
Conversely, a rejection from the current resistance could see prices fall back. A break below the $2.97 level could signal that sellers are taking control, with initial support seen at the 20-day SMA near $2.88. Further weakness could expose lower targets at $2.78 and the major low of $2.62.
Read next
More on Commodities
U.S. Crude Inventories Post Surprise Draw While Gasoline Stocks Swell, EIA Reports
U.S. crude oil stockpiles fell unexpectedly last week, driven by a surge in exports, while gasoline inventories saw a significant build amid weakening demand, according to the latest EIA data.

UBS Raises Year-End Brent Forecast to $110 on Middle East Supply Risks
UBS has increased its year-end forecast for Brent crude to $110 per barrel, citing escalating supply risks in the Middle East, declining global inventories, and record-high freight costs.
Iran Dismisses Latest Qatari Peace Proposal as 'Unacceptable'
A senior Iranian official has rejected the latest Qatari-mediated draft deal to end the eight-month war, calling the ideas 'unacceptable' and signaling a continued diplomatic impasse. The news comes amid rising oil prices following attacks on Saudi energy infrastructure.

Argentina Poised to Gain EU Soymeal Market Share as Deforestation Rules Hit Brazil
Argentina's soybean industry is preparing to capture a larger share of the European Union's soymeal market as new EU anti-deforestation rules are expected to disrupt exports from rival Brazil.