
Story
Micron Stock Faces Technical Squeeze Between $870 Support and $910 Resistance
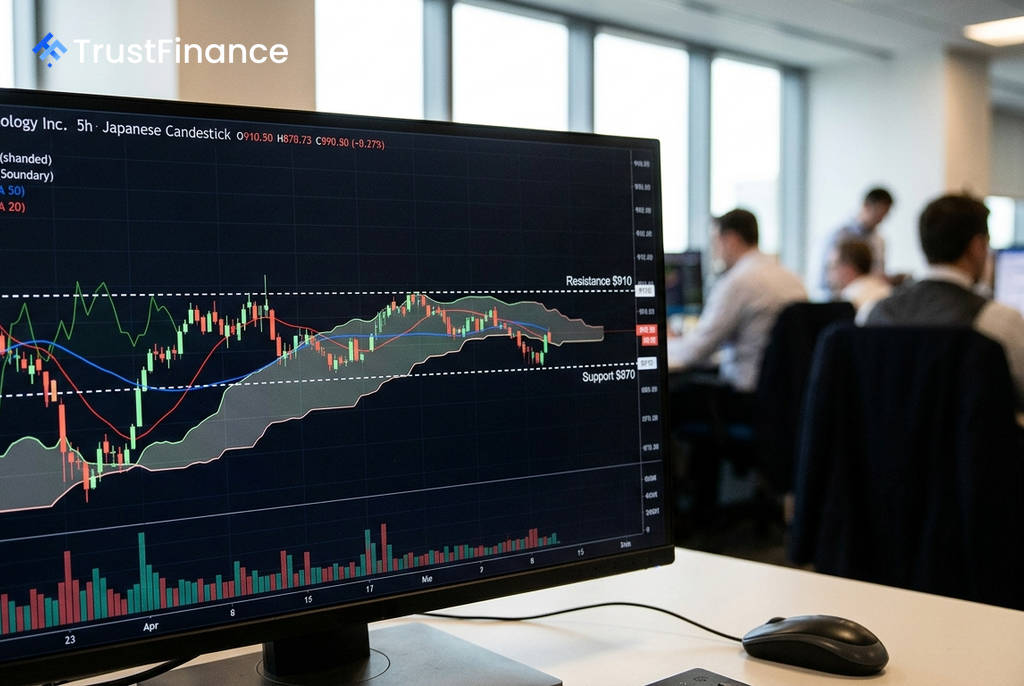
Micron (MU) stock is currently locked in a tight consolidation pattern, signaling a period of indecision among traders as the price oscillates between key technical levels. Analysis of the stock's 5-hour chart indicates a struggle between short-term bullish momentum and medium-term bearish pressure, setting the stage for a potentially volatile move.
A Battle Between Support and Resistance
The stock's price action is defined by a narrow trading range, with a clear support level established at $870 and a formidable resistance zone near $910. According to a technical report from Investing.com, this upper barrier is strengthened by the convergence of the 50-period Simple Moving Average (SMA) and the Ichimoku cloud, creating a significant hurdle for buyers.
This price action is described as a "trapped price" scenario, where the stock is trading within the Ichimoku cloud—a technical indicator zone often associated with market equilibrium or choppy, unpredictable trading. The area between $870 and $910 is considered a high-risk zone for trend-following strategies due to the increased probability of false breakouts and reversals, often referred to as "whipsaws."
Bullish and Bearish Scenarios
Traders are closely monitoring key levels for signs of a new directional trend. The outlook depends on which side of the current range the stock breaks.
 Ad
- The Bullish Case: Short-term indicators show some positive signs, with the price above its 20-period SMA and the Volume Weighted Average Price (VWAP), supported by a bullish MACD crossover. A sustained move and close above $930 would be seen as a bullish confirmation, with potential upside targets identified at $1,010 and higher.
- The Bearish Case: The medium-term trend remains under bearish control as long as the price stays below the 50-period SMA and within an active descending channel pattern. A break below support at $867 would signal renewed selling pressure, with an initial downside target at the recent swing low of $820.
Market Context and Outlook
The current technical setup underscores the importance of patience and confirmation for investors. A high-volume node, indicating significant trading activity, is present between $850 and $900, highlighting this area's importance as a pivot point. A decisive, high-volume move out of this range is needed to validate either a breakout or a breakdown.
The stock's Average True Range (ATR) of 5.4% suggests that volatility remains elevated, meaning price swings can be significant. Until a clear break occurs, the stock is likely to remain in this state of consolidation as market participants await a catalyst to drive the next definitive move.
Read next
More on Stocks
FTC Orders Walmart, Uber, Delta to Disclose Data on Personalized Pricing
The U.S. Federal Trade Commission is demanding nine major companies, including leading retail, travel, and gig economy firms, to provide information on how they use consumer data for setting individual prices and wages.

Google Launches Gemini 4 Carbon AI Model to Bolster Cybersecurity Capabilities
Alphabet's Google has unveiled Gemini 4 Carbon, its latest AI model specifically designed for advanced cybersecurity tasks like vulnerability detection and secure code generation. The launch escalates competition with rivals OpenAI and Anthropic in the enterprise AI market.

Oracle Shares Surge After Unveiling $225 Billion Revenue Target for 2030
Oracle stock rose sharply after the company presented a long-term financial outlook targeting at least $225 billion in annual revenue by fiscal 2030, driven by its expanding AI infrastructure business.

DOJ Scrutinizes Nvidia's $12.9B Hugging Face Deal Amid Broader Antitrust Probe, Sources Say
The U.S. Department of Justice is reportedly examining Nvidia's planned $12.93 billion acquisition of AI platform Hugging Face as part of a wider, ongoing antitrust investigation into the chipmaker's market conduct.