
Story
Gold Price Consolidates Below $4,150 as Bearish Technical Pattern Forms
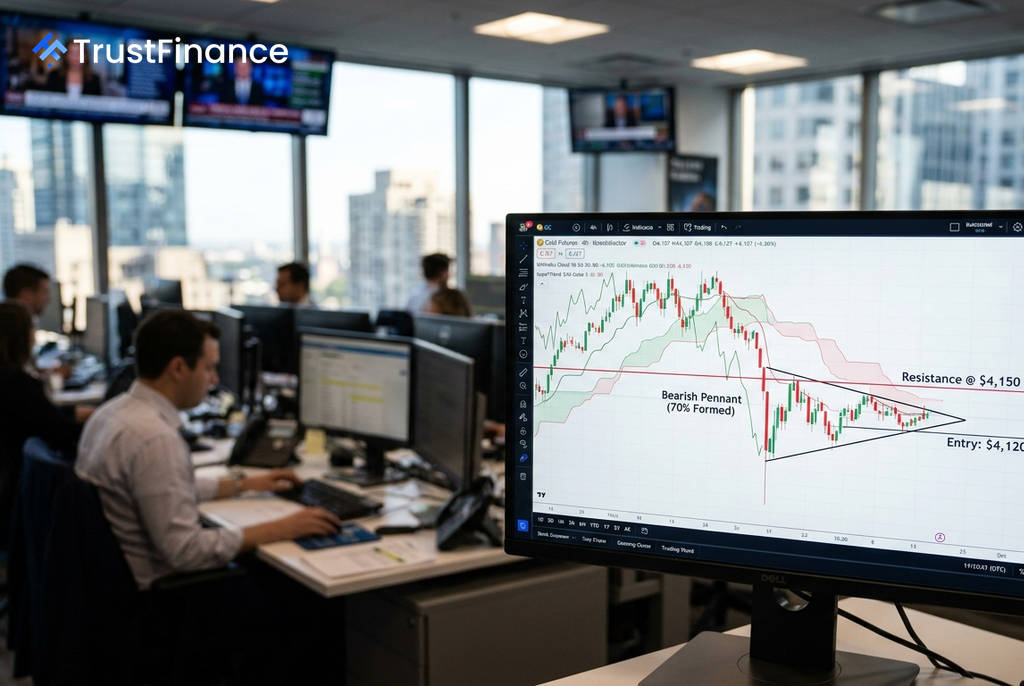
Gold prices are consolidating in a tight range below a key resistance zone, with technical indicators suggesting a growing probability of a continued downtrend. The precious metal was trading near $4,107 as a classic bearish chart pattern, known as a pennant, takes shape on the four-hour chart.
Resistance Holds Firm
The primary battleground for gold traders is the resistance area between $4,130 and $4,150. According to analysis from Investing.com, every attempt by buyers to push the price into this zone has been met with significant selling pressure. A notable rejection was marked by a "shooting star" candlestick pattern at $4,124 on July 10, underscoring the strength of this overhead supply.
Price action has become congested in what the analysis terms a "no-trade zone" between $4,080 and $4,125. This narrow range reflects market indecision, and traders are watching for a decisive break to signal the next directional move.
Bearish Technical Outlook
The dominant technical signal is a bearish pennant, a continuation pattern that typically forms after a sharp price drop and often resolves with another move lower. The pattern is reportedly about 70% complete, suggesting a breakout could be imminent.
 Ad
Several other indicators support a bearish bias, according to the source's analysis:
- The price remains below the SuperTrend indicator, a key trend-following metric, currently at $4,192.
- Gold is also trading below the top of the Ichimoku Cloud, another technical indicator used to identify trend and momentum.
- Declining trading volume during the consolidation is characteristic of a pennant pattern, often preceding a volume surge on the eventual breakout.
Potential Scenarios and Key Levels
For the bearish trend to continue, sellers would need to push the price below the current consolidation range. A confirmed breakdown could open the door to lower targets, with initial support levels identified at $4,065 and, subsequently, $4,032.
To invalidate the bearish outlook, buyers would need to stage a powerful rally. A sustained close above the $4,192 level would be required to signal a significant shift in trend. Analysts caution that a brief move above $4,150 that fails to hold could be a "bull trap," quickly reversing lower.