
Story
Citi Sets €217 Price Target for Airbus, but Bull Case Hinges on Aggressive Assumptions
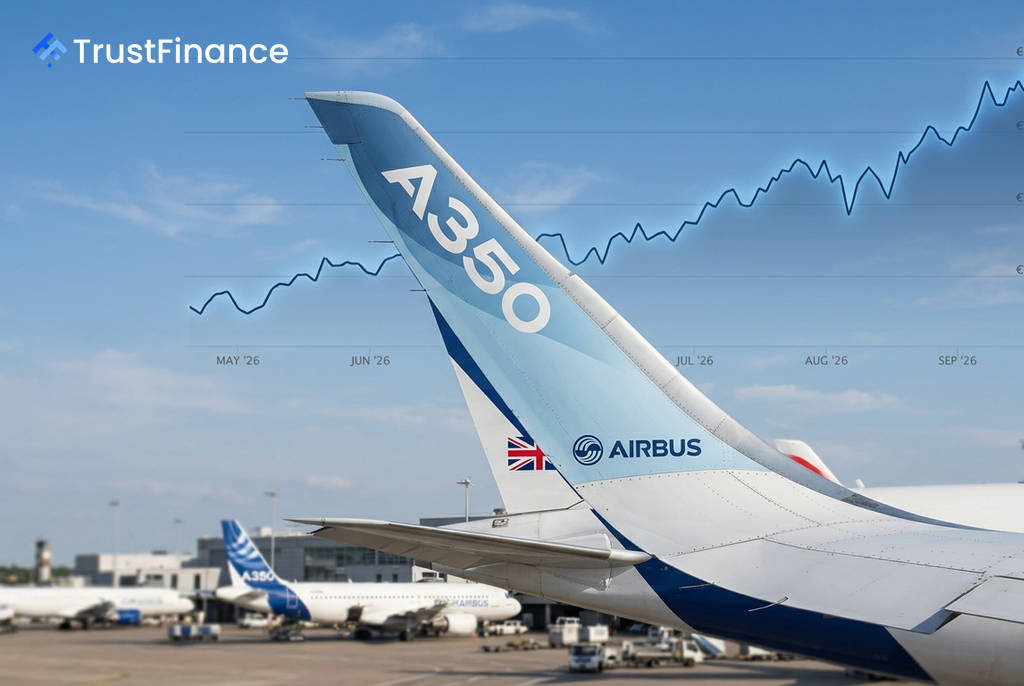
Citi has initiated a price target of €217 for Airbus Group SE (AIR), suggesting a potential upside of 9.3% from its recent trading price of €198.54. However, the bank's valuation model is underpinned by highly ambitious financial assumptions, leaving a thin margin of safety for investors.
Citi's Ambitious Forecast
The bank's bull case for Airbus relies on several demanding long-term projections. Analysts' discounted cash flow (DCF) model requires the company to achieve flawless operational execution to justify the target price.
Key assumptions in Citi's model include:
- A 13.5% compound annual growth rate (CAGR) for earnings before interest, taxes, and amortization (EBITA) from 2026 to 2031.
- An exceptionally high long-term operating cash conversion rate of 97%.
- A 2026 enterprise value to EBIT (EV/EBIT) multiple of 21x.
The 97% cash conversion assumption is particularly aggressive. It implies that nearly every dollar of accounting profit must be converted into cash, a difficult feat for an industrial company susceptible to working-capital pressures, inventory build-ups, or delivery delays.
Valuation and Market Context
 Ad
While Citi's target offers modest upside, other valuation metrics suggest the stock is already priced for significant growth. According to Investing.com's platform, Airbus's fair value is estimated at €200.16, just 0.8% above its current price, indicating limited valuation protection.
The stock currently trades at a forward price-to-earnings (P/E) ratio of 27.0x, reflecting high investor expectations. The primary risk for the stock is potential valuation compression if Airbus fails to meet Citi's lofty EBITA growth targets or if its cash conversion normalizes to a lower, more typical level.
Conflicting Technical Signals
Technical indicators for Airbus present a mixed picture. The daily chart signals a 'Strong Sell', with the Relative Strength Index (RSI) at 40.8 and a negative MACD. This aligns with the stock's 7.24% decline over the past month.
Conversely, the weekly chart maintains a 'Buy' signal, with a positive MACD and an RSI of 53.1. This suggests the recent downturn may be a short-term pullback within a stronger medium-term uptrend, as the stock remains up 12.20% over the last three months. Key technical support is seen near €194.16, with resistance around the €200.69–€203.52 range.
Read next
More on Stocks
FTC Orders Walmart, Uber, Delta to Disclose Data on Personalized Pricing
The U.S. Federal Trade Commission is demanding nine major companies, including leading retail, travel, and gig economy firms, to provide information on how they use consumer data for setting individual prices and wages.

Google Launches Gemini 4 Carbon AI Model to Bolster Cybersecurity Capabilities
Alphabet's Google has unveiled Gemini 4 Carbon, its latest AI model specifically designed for advanced cybersecurity tasks like vulnerability detection and secure code generation. The launch escalates competition with rivals OpenAI and Anthropic in the enterprise AI market.

Oracle Shares Surge After Unveiling $225 Billion Revenue Target for 2030
Oracle stock rose sharply after the company presented a long-term financial outlook targeting at least $225 billion in annual revenue by fiscal 2030, driven by its expanding AI infrastructure business.

DOJ Scrutinizes Nvidia's $12.9B Hugging Face Deal Amid Broader Antitrust Probe, Sources Say
The U.S. Department of Justice is reportedly examining Nvidia's planned $12.93 billion acquisition of AI platform Hugging Face as part of a wider, ongoing antitrust investigation into the chipmaker's market conduct.