
Story
Alphabet Stock Tests Critical $337 Support Amid Bearish Technical Signals
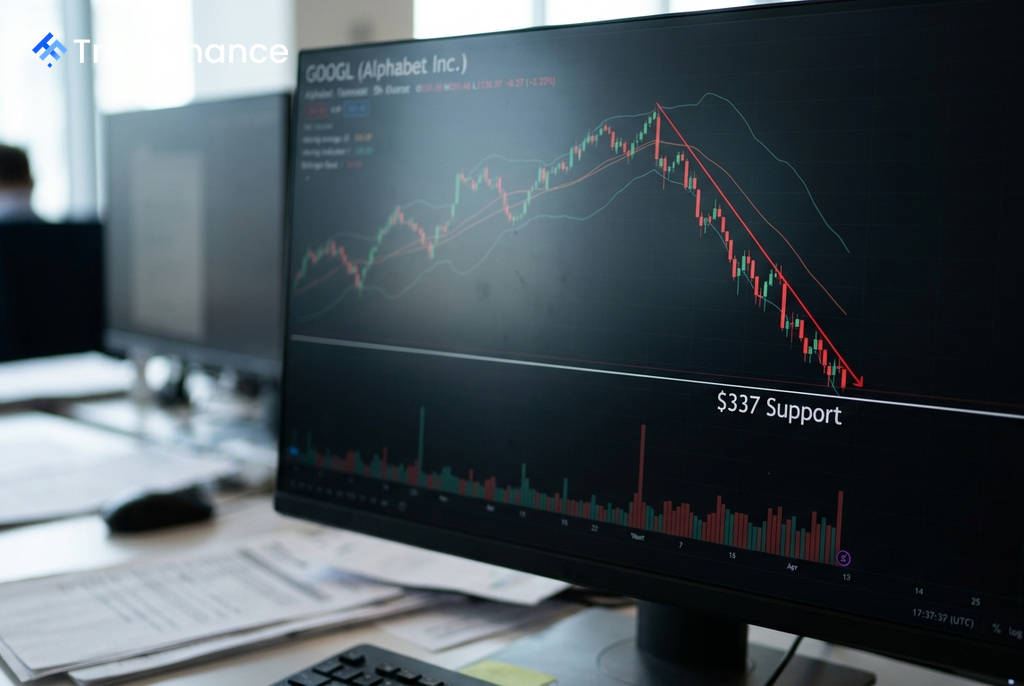
Alphabet's Class A stock (GOOGL) is precariously positioned above the critical $337 support level, a price floor that has held over multiple sessions, according to technical analysis from Investing.com. As of the Aug. 31, 2026 report, the stock's price action suggests a make-or-break moment for traders, with a potential for significant movement depending on whether this support holds.
Bearish Indicators Mount
A confluence of technical signals points to persistent downside pressure on the stock. According to the 5-hour chart analysis, a bearish case is supported by several key indicators:
- The stock is trading below its 20, 50, and 200-period moving averages, which are often viewed as indicators of a downtrend.
- A bearish signal from the Moving Average Convergence Divergence (MACD) indicator is active.
- The price remains below the Ichimoku cloud, another signal of bearish market sentiment.
- A bear flag pattern, a classic continuation pattern suggesting further declines, is reportedly 90% complete.
Potential Scenarios and Key Levels
The primary scenario outlined by the analysis is bearish. A confirmed close below the $337 support could trigger a swift decline toward subsequent targets at approximately $329 and potentially $315. The major overhead resistance for the stock is identified at the $350 level.
 Ad
However, the analysis also notes a significant caveat: market momentum appears weak, with the Average Directional Index (ADX) at a low 13.5. This lack of strong momentum raises the possibility of a "bear trap," where a breakdown below support fails to gather steam and quickly reverses. Analysts suggest that a surge in trading volume would be necessary to confirm a genuine breakdown.
Market Context
For investors and traders monitoring Alphabet, the immediate focus remains on the battle at the $337 support zone. A decisive move in either direction could set the tone for the stock's near-term trajectory. The price range between $337 and $343 is considered a potential "no-trade zone" due to choppy conditions and mixed signals.
A contrarian bullish case, while considered low-probability, could emerge if the stock bounces from the lower Bollinger Band. However, any upward move would face significant resistance from the cluster of moving averages and the key $350 price ceiling.
Read next
More on Stocks
FTC Orders Walmart, Uber, Delta to Disclose Data on Personalized Pricing
The U.S. Federal Trade Commission is demanding nine major companies, including leading retail, travel, and gig economy firms, to provide information on how they use consumer data for setting individual prices and wages.

Google Launches Gemini 4 Carbon AI Model to Bolster Cybersecurity Capabilities
Alphabet's Google has unveiled Gemini 4 Carbon, its latest AI model specifically designed for advanced cybersecurity tasks like vulnerability detection and secure code generation. The launch escalates competition with rivals OpenAI and Anthropic in the enterprise AI market.

Oracle Shares Surge After Unveiling $225 Billion Revenue Target for 2030
Oracle stock rose sharply after the company presented a long-term financial outlook targeting at least $225 billion in annual revenue by fiscal 2030, driven by its expanding AI infrastructure business.

DOJ Scrutinizes Nvidia's $12.9B Hugging Face Deal Amid Broader Antitrust Probe, Sources Say
The U.S. Department of Justice is reportedly examining Nvidia's planned $12.93 billion acquisition of AI platform Hugging Face as part of a wider, ongoing antitrust investigation into the chipmaker's market conduct.