
Story
WTI Crude Oil Rally Stalls Near $104.50 as Momentum Indicators Weaken
Summary
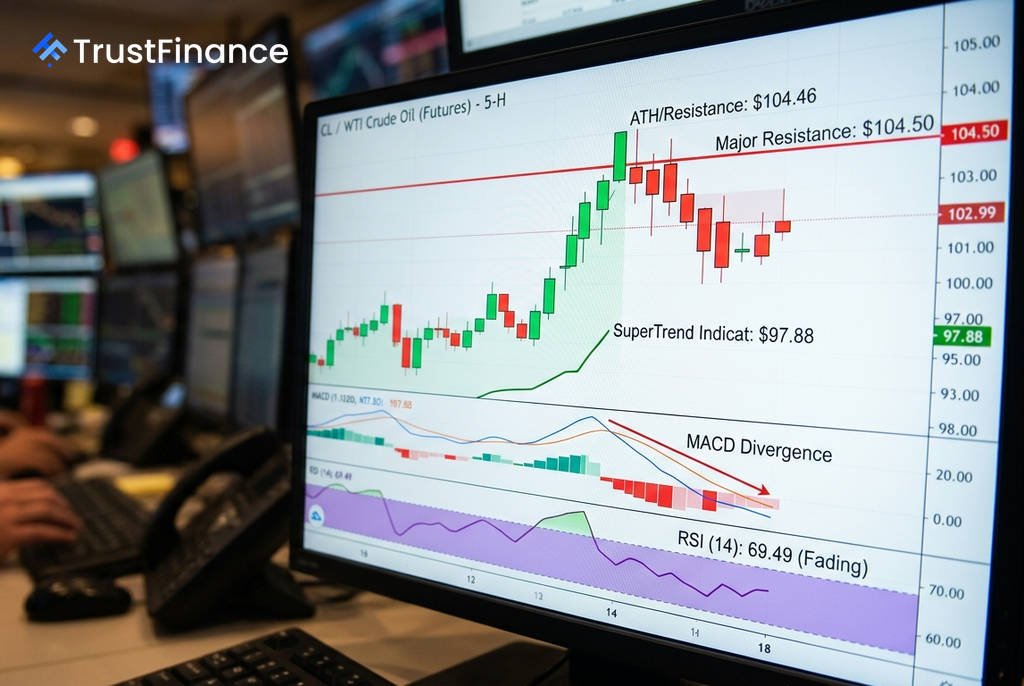
West Texas Intermediate crude oil has paused its sharp ascent near the $104.46 resistance level. Technical signals such as a weakening MACD and a near-overbought RSI suggest the rally is losing steam, putting key support levels in focus.
West Texas Intermediate (WTI) crude oil's recent powerful advance has stalled near its prior peak of $104.46, as technical indicators suggest waning momentum and potential buyer exhaustion. The market is now watching critical support levels to determine if the rally can resume or if a price correction is imminent.
Rally Loses Steam Near Key Resistance
The benchmark U.S. crude contract, trading around $102.99 in recent hours, has paused following a sharp, parabolic surge that pushed it nearly 10% above its 50-bar moving average. According to an analysis of short-term charts, this hesitation near a significant resistance zone is accompanied by declining trading volume, a classic sign that conviction among buyers may be fading.
Technical Indicators Flash Warning Signs
Several technical indicators are signaling a potential loss of upward momentum, raising the risk of a reversal for oil prices. These signals suggest that while the trend remains bullish, the immediate upward force is diminishing.
 Ad
Ad- The Moving Average Convergence Divergence (MACD) histogram is showing a decline, indicating that the strength of the uptrend is weakening.
- The Relative Strength Index (RSI) is at 69.49, just below the 70 level that is widely considered to be overbought territory.
- A lower high pattern appears to be forming on the chart below the $104.46 peak, which can be a precursor to a change in trend.
Key Price Levels to Watch
Traders are closely monitoring key price zones that could dictate oil's next directional move. A critical support area has formed between $97.88 and $98.50, where multiple technical indicators converge. A sustained break below this level could trigger a rapid sell-off, a phenomenon known as mean reversion.
Conversely, the primary resistance zone remains between $103.50 and the peak of $104.46. A decisive close above this ceiling would be a strong bullish signal, potentially attracting a new wave of momentum-based buying and targeting higher prices.
Read next
More on Commodities
European Gas Prices Surge 5% as JERA CEO Warns of Critically Low Reserves
European and UK natural gas prices jumped nearly 5% on Monday, hitting multi-year highs amid worsening Mideast shipping disruptions and a stark warning from a major LNG buyer about critically low storage levels.

Wheat Futures Slip on Hopes for Easing Black Sea Tensions
Wheat futures contracts closed lower on Monday following reports of a potential agreement between Russia and Ukraine to de-escalate conflict in the Black Sea, though the news was met with official skepticism.

Northwest Europe Gasoline Margins Jump to $52 a Barrel Amid Active Trading
Gasoline refining margins in Northwest Europe surged by approximately $3 to $52 a barrel on Monday, driven by a high volume of physical trades and reports of a Russia-Ukraine agreement to spare energy infrastructure.

Soybean Futures Rebound on US-China Meeting Hopes
Soybean prices recovered on Monday as traders anticipated a forthcoming meeting between U.S. and Chinese leaders, offsetting bearish pressure from a recent USDA report forecasting a larger harvest.