
Story
Soybean Futures Consolidate in Bear Flag Pattern, $1235 Support Level in Focus

Soybean futures are consolidating within a tight trading range after a recent decline, forming a technical bear flag pattern that suggests the downtrend could resume. The market is showing signs of indecision as traders watch key support and resistance levels for the next directional cue, with a critical floor at $1235 per bushel.
Technical Picture Signals Downturn
The current price action is characterized as a consolidation phase within a dominant 5-hour downtrend, according to a technical analysis by Investing.com. This pause has formed a bear flag chart pattern, which is estimated to be about 80% complete. In technical analysis, a bear flag is a continuation pattern that often precedes another move lower.
The immediate trading channel is defined by support near $1243 and a resistance zone around $1261. The market is currently caught between these levels, awaiting a catalyst to trigger a breakout in either direction.
Key Levels and Conflicting Indicators
A cluster of technical indicators highlights the market's current state of uncertainty, with both bullish and bearish signals present. The most significant level for bears is the recent swing low and structural support at $1235. A definitive break below this price could accelerate selling pressure.
 Ad
On the upside, formidable resistance is located between $1260 and $1267, an area that includes the 50-period simple moving average (SMA) and the top of the Ichimoku cloud. While the broader trend remains negative, some indicators suggest a potential for short-term stabilization:
- Bearish signals: The price is trading below the 50-period SMA, and a SuperTrend indicator is providing an active sell signal.
- Neutral signals: Price action is confined within the Ichimoku cloud, signaling trend indecision. A recent Doji candlestick also points to market hesitation.
- Bullish signals: The MACD indicator has posted a bullish crossover, and the Relative Strength Index (RSI) is recovering from oversold conditions.
Scenarios for a Breakout
Technical analysis points to two primary scenarios depending on which key level breaks first. A sustained close on the 5-hour chart below the $1235 support would confirm the bear flag pattern. This could open the way for further declines, with a potential target at the 127.2% Fibonacci extension level near $1208.
Conversely, a decisive move above the $1267 resistance would invalidate the immediate bearish setup. Such a breakout could signal a stronger recovery, bringing higher Fibonacci retracement levels at $1274 and $1285 into focus as potential targets for buyers.
Read next
More on Commodities
U.S. Crude Inventories Post Surprise Draw While Gasoline Stocks Swell, EIA Reports
U.S. crude oil stockpiles fell unexpectedly last week, driven by a surge in exports, while gasoline inventories saw a significant build amid weakening demand, according to the latest EIA data.

UBS Raises Year-End Brent Forecast to $110 on Middle East Supply Risks
UBS has increased its year-end forecast for Brent crude to $110 per barrel, citing escalating supply risks in the Middle East, declining global inventories, and record-high freight costs.
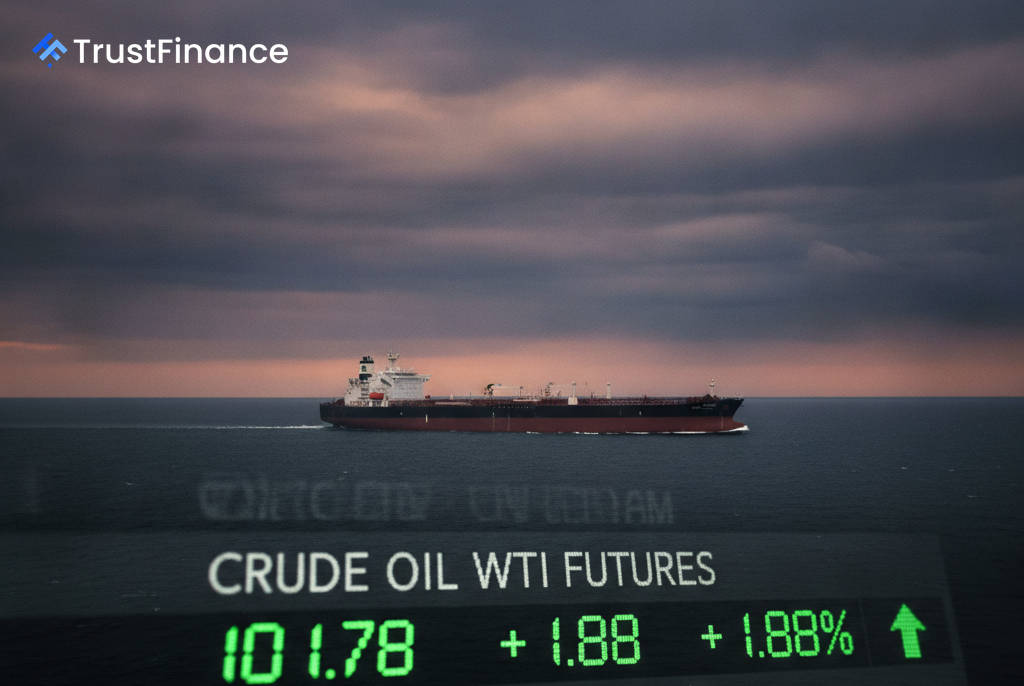
Iran Dismisses Latest Qatari Peace Proposal as 'Unacceptable'
A senior Iranian official has rejected the latest Qatari-mediated draft deal to end the eight-month war, calling the ideas 'unacceptable' and signaling a continued diplomatic impasse. The news comes amid rising oil prices following attacks on Saudi energy infrastructure.

Argentina Poised to Gain EU Soymeal Market Share as Deforestation Rules Hit Brazil
Argentina's soybean industry is preparing to capture a larger share of the European Union's soymeal market as new EU anti-deforestation rules are expected to disrupt exports from rival Brazil.