
Story
Nasdaq 100 Trades in Tight 500-Point Range, Signaling Potential Breakout
Summary
The Nasdaq 100 is consolidating within a narrow price range on its hourly chart, with technical indicators suggesting a significant directional move could be imminent as volatility subsides.
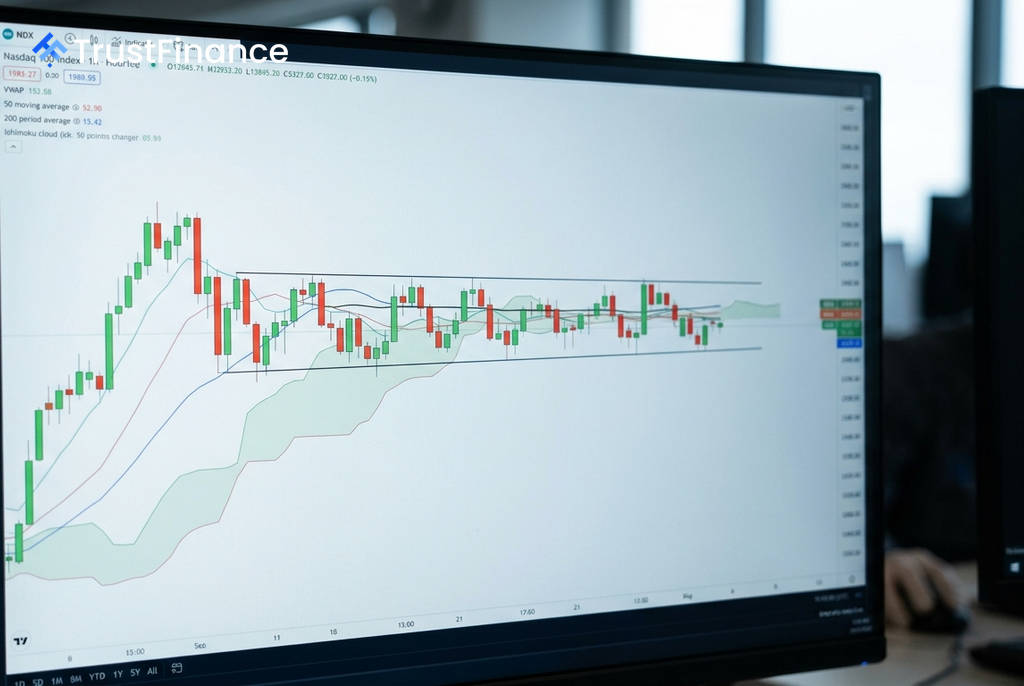
The Nasdaq 100 index is locked in a tight consolidation pattern, trading within a roughly 500-point range between key support and resistance levels, according to technical analysis of its hourly chart. This period of low volatility and price compression suggests the market may be building energy for a significant directional move.
A Coiled Spring
The index has been contained between established support near 29,101 and resistance at 29,692. This narrow channel is further reinforced by major technical indicators, creating a state of market indecision.
- Moving Averages: The price is squeezed between its long-term 200-period moving average (around 29,321) acting as support and its medium-term 50-period moving average (around 29,468) as resistance.
- Indecision Signals: The index is hovering near its volume-weighted average price (VWAP) and trading inside the Ichimoku cloud, both of which typically signal a lack of a clear, established trend.
- Volatility: A falling Average True Range (ATR), a key measure of market volatility, indicates that price movement has become subdued, a condition that often precedes a sharp breakout.
Potential Breakout and Breakdown Levels
 Ad
AdMarket participants are closely watching for a decisive move outside this range to confirm the next short-term trend. A sustained close above resistance or below support could trigger a larger price swing.
In a bullish scenario, a confirmed break above the 29,692 resistance level could signal upward momentum, with technical analysis pointing to a potential next target near 30,272. Conversely, a breakdown below the support floor at 29,101 could initiate a bearish move, with a potential downside target identified near 28,740.
What This Means for the Market
This type of consolidation reflects uncertainty among investors and a temporary equilibrium between buyers and sellers. While such patterns often resolve with a powerful move, the initial break can sometimes be a "fakeout," where the price briefly pierces a level before reversing. For this reason, traders often look for confirmation, such as a session close outside the established range, to validate the new direction.
Read next
More on Stocks
ExxonMobil in Advanced Talks for Venezuela Return, Eyeing Former Orinoco Project
The U.S. oil major is reportedly negotiating a return to the Petromonagas heavy oil project, a significant reversal nearly two decades after its assets were nationalized by the Venezuelan government.

US House Passes Bill Targeting Data Center Power Grid Costs
The U.S. House of Representatives has advanced the Ratepayer Protection Act, the first legislation of its kind aimed at making large power users like data centers bear the costs of new electricity infrastructure.

New Zealand's Q2 GDP Growth Exceeds Forecasts but Remains Tepid at 0.2%
New Zealand's economy grew 0.2% in the second quarter, topping analyst and central bank forecasts, according to official data. However, the pace of expansion remains slow amid persistent economic headwinds and recent interest rate hikes.

Snap Partners With Salesforce, Nvidia to Target Enterprise Market With AR Glasses
Snap Inc. has announced strategic partnerships with Salesforce, Nvidia, and Amazon Web Services to integrate enterprise-grade AI and software tools into its Specs augmented-reality glasses, signaling a major push into the corporate market.