
Story
London Gas Oil Rally Pauses Near $1,280 as Technical Indicators Signal Exhaustion
Summary
London Gas Oil prices have pulled back after a strong breakout, with technical indicators suggesting the rally may be overextended. Traders are closely watching key resistance around $1,328 for signs of a potential reversal or consolidation.
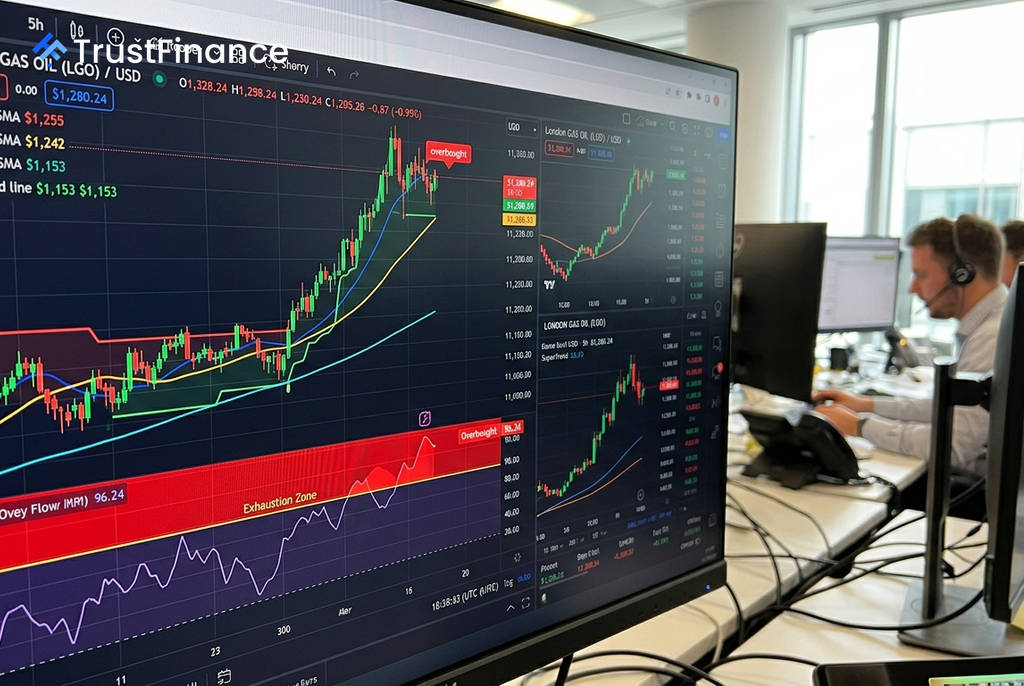
London Gas Oil prices pulled back to $1,280.24 in recent trading, showing signs of losing momentum after a significant rally, according to technical chart analysis from Investing.com. While the trend remains bullish, key indicators are now flashing their most extreme "overbought" signals in months, raising questions about the sustainability of the recent gains.
Technical Picture Shows Strain
The recent price action has kept London Gas Oil above several key technical supports, indicating that buyers are still in control for now. According to the 5-hour chart data, the price remains above its 20-period, 50-period, and 200-period simple moving averages ($1,255, $1,242, and $1,153, respectively).
However, warning signs of buyer exhaustion are emerging. The Money Flow Index (MFI), a momentum indicator that measures buying and selling pressure, has surged to 96.24. A reading above 80 is typically considered overbought, suggesting the asset may be due for a pullback. Furthermore, the Average Directional Index (ADX), which measures trend strength, is at a relatively low 11.88, indicating that the underlying momentum of the rally is weak.
Key Levels in Focus for Traders
Market participants are now focused on a critical resistance zone near the last swing high of $1,328. A failure to break through this level could establish a "double top," a classic bearish reversal pattern that can trigger sharp corrections.
 Ad
AdAnalysts note this area represents a potential "bull trap," where a breakout appears to be underway but quickly fails, trapping buyers who entered the market late. On the downside, a significant area of technical support is seen between $1,240 and $1,255, a range reinforced by moving averages and other indicators.
Market Outlook
The current technical setup presents a conflict for investors. While all major trend indicators remain bullish following the recent range breakout, the extreme overbought readings from momentum oscillators suggest caution is warranted.
The market's reaction to the $1,328 resistance level will be a crucial test. A decisive break above this point could signal a continuation of the rally, while a rejection could confirm that buyers are exhausted and lead to a deeper price correction.
Read next
More on Commodities
Houthi Rebels Claim Missile Strike on Riyadh; Saudis Report Interception
Yemen's Houthi rebels have claimed responsibility for a missile and drone attack on "sensitive" sites in Riyadh, following reports of fire and smoke near the city's main airport. Saudi authorities confirmed they intercepted a missile aimed at the capital.

Petrobras Board Approves Participation in New Government Diesel Subsidy
Brazil's state-controlled oil company will join a new government program offering a 1.00 real per liter subsidy on diesel, a move aimed at controlling fuel prices ahead of the October presidential election.

Canada Aims to Conclude India Trade Deal by Year-End, Minister Says
Canada's international trade minister expressed strong optimism about finalizing a comprehensive economic partnership agreement with India by the end of the year, with key talks centered on energy, nuclear cooperation, and critical minerals.

Gold Prices Steady as Investors Monitor US-China Summit, Middle East Tensions
Gold prices held flat in Asian trading as the market weighed the impact of upcoming high-level U.S.-China talks against persistent geopolitical risks in the Middle East.