
Story
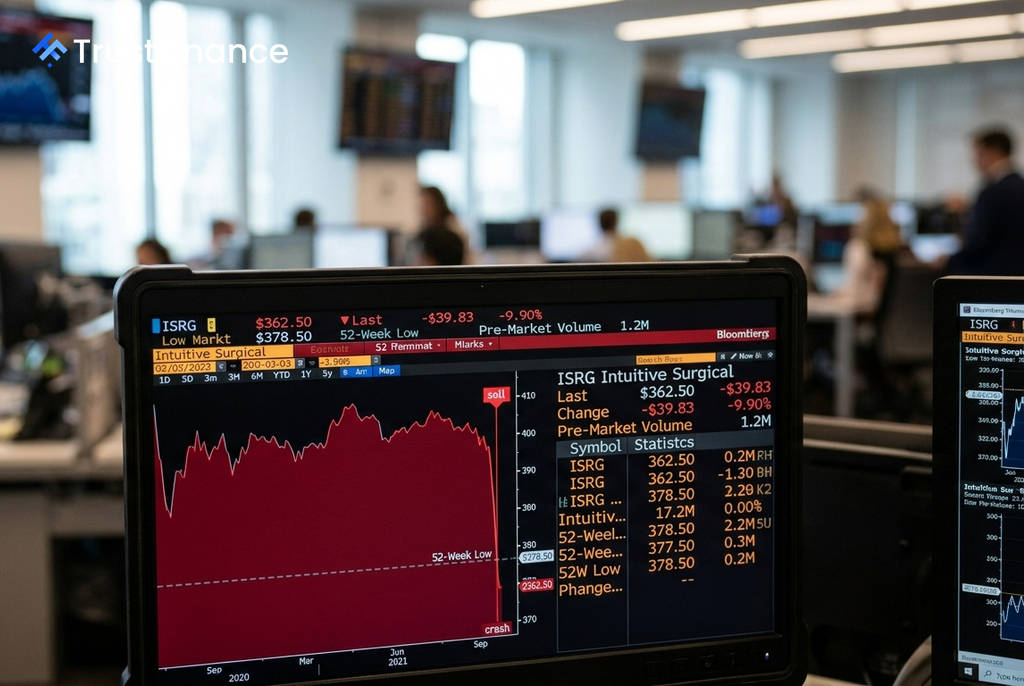
Intuitive Surgical Stock Plunges Below 52-Week Low in Pre-Market Trading
Summary
Shares of Intuitive Surgical (ISRG) fell nearly 10% in pre-market activity, breaking below a key psychological and technical support level. Technical analysis points to a critical support zone near $351 if the initial selling pressure continues.
Intuitive Surgical (NASDAQ: ISRG) shares plunged in pre-market trading Friday, falling below their 52-week low in a move that places the stock in technically uncharted territory for the year. The drop signals significant bearish momentum and has erased several layers of technical support ahead of the market open.
The Pre-Market Breakdown
The surgical robotics company saw its stock price fall to approximately $362.50 in pre-market hours, a decline of -9.9% from its previous closing price of $402.33, according to data from Investing.com. This sharp drop pushed the stock well below its prior 52-week low of $378.50.
Breaching a 52-week low is often a psychologically significant event for investors. It can trigger automated stop-loss orders and accelerate selling pressure from institutional holders, turning a former support level into a new ceiling of resistance that the stock must overcome to recover.
Key Technical Levels to Watch
With the pre-market decline, ISRG shares have sliced through multiple daily pivot support levels. The last of these, the S3 daily pivot, was at $364.86, a level the stock was already trading below before the opening bell.
Analysts are now watching a deeper support zone for potential stabilization. According to technical analysis from Investing.com, the next major area of support is a confluence zone between the weekly and monthly S3 pivots, located around $351–$352. A break below current levels could open a path for the stock to fall another $11 to $12 to test this zone.
 Ad
AdFor a potential recovery, traders will be watching two key upside levels:
- $371.68: A daily support level that would need to be reclaimed to signal short-term stabilization.
- $378.50: The former 52-week low, which now acts as significant overhead resistance. A firm move back above this price would be required to suggest a more meaningful recovery is underway.
Investor Outlook
The technical picture presents a challenging outlook for the stock. The weekly trend indicator is a "Strong Sell," suggesting the downward momentum is well-established and not just a one-day event. Furthermore, the daily Relative Strength Index (RSI) of 46.3 is not yet in oversold territory, indicating there could be more room for the price to fall before a technical bounce is triggered.
However, some very short-term indicators are flashing oversold signals, which could lead to brief bounces fueled by short-covering. The key level to watch at the market open will be whether the stock can hold above the $364.86 area. A failure to do so would keep the focus squarely on the deeper support near $351.
Read next
More on Stocks
European Telecoms Face AI-Driven Price Pressure, Bank of America Warns
Bank of America analysts report that while AI agents could increase customer churn for European telecom operators by simplifying price comparisons, the technology also offers powerful tools for sales and personalized customer retention.

ShinyHunters Hackers Renew Attacks on Oracle PeopleSoft Flaw, Google's Mandiant Reports
Google's cybersecurity unit, Mandiant, reports that the hacking group ShinyHunters has resumed and adapted its exploitation of a known vulnerability in Oracle's PeopleSoft enterprise software, targeting organizations that failed to apply a full security patch.

Manulife Stock Climbs, Supported by Cross-Border Investor Optimism
Shares of Manulife Financial gained on Tuesday, buoyed by a strong performance in U.S. markets rather than any specific company news. The stock's move is also supported by a bullish technical posture and positive analyst ratings.

Escondida Union Rejects BHP's Bid to Pause Talks After Fatal Accident
A union at the world's largest copper mine, Escondida, has rejected a request from operator BHP to postpone contract negotiations following a fatal accident earlier this week. The union accused the company of using the tragedy to delay the collective bargaining process.