
Story
Emerson Electric Stock Shows Bullish Trend Amid Signs of Short-Term Overheating
Summary
Emerson Electric's stock is supported by a strong long-term uptrend across multiple timeframes, but several short-term technical indicators are signaling overbought conditions that could precede a pullback.
Shares of Emerson Electric (NYSE: EMR) are exhibiting a solidly bullish long-term structure, though technical analysis from Investing.com suggests the stock is flashing short-term caution signs. While the prevailing trend remains positive, several indicators point to potential overheating that could lead to a period of consolidation or a price correction.
Broad Trend Remains Positive
Across daily, weekly, and monthly charts, Emerson's price action is supported by key moving averages, a signal of a healthy underlying uptrend. The stock was trading at $161.38 on October 2, well above its primary support levels.
- Daily Chart: The price is above the 20-day Simple Moving Average (SMA) at $153.04 and the 200-day SMA at $144.63.
- Weekly Chart: The longer-term trend is confirmed with the price above the 50-week SMA ($142.82) and the 200-week SMA ($115.86).
Momentum indicators like the Relative Strength Index (RSI) and Moving Average Convergence Divergence (MACD) are also constructive, remaining in bullish territory without being excessively high on weekly and monthly charts, according to the analysis.
Short-Term Overheating Signals
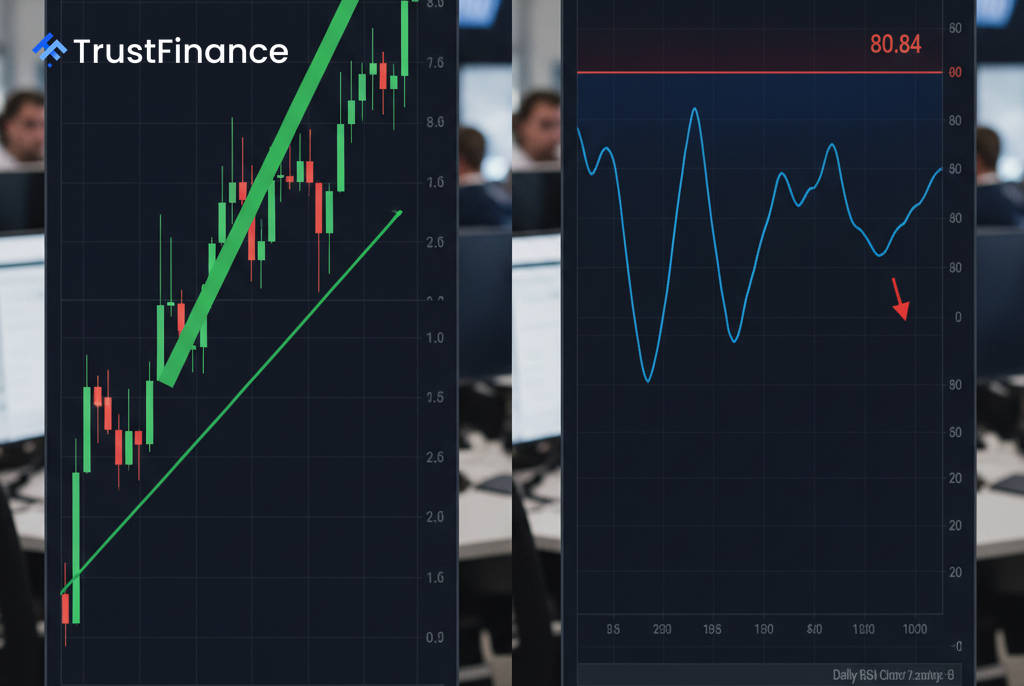
Despite the positive long-term picture, several daily indicators suggest the recent rally may be overextended. A bearish "Doji Star" candlestick pattern is reportedly emerging on the daily chart, which can sometimes signal a trend reversal.
 Ad
AdFurthermore, oscillators that measure the speed of price movements are in overbought territory:
- The Daily Stochastic RSI is at 80.84.
- The Daily Williams %R is at -13.49.
Readings at these levels indicate that the stock's upward momentum could be fading. The Average Directional Index (ADX), a measure of trend strength, is also relatively low at 17.38 on the daily chart, suggesting the current uptrend lacks strong conviction.
Key Level for Investors to Watch
The conflicting signals present a nuanced picture for investors. While the long-term structure supports a bullish outlook, the short-term overbought readings warrant caution. The key technical level to monitor is the 20-day SMA, currently near $153.04.
A sustained hold above this level would preserve the stock's near-term positive momentum. Conversely, a break below it would weaken the short-term technical setup and could signal the start of a deeper price correction, according to the Investing.com analysis.
Read next
More on Stocks
Federal Judge Allows Union's Trademark Lawsuit Against Starbucks to Proceed
A federal judge has denied Starbucks' request to dismiss a lawsuit filed by Workers United, allowing the union's case over the use of the company's name and logo to move forward amid an ongoing labor dispute.

Electrical Equipment Stocks See High Demand, But Valuations Flash Warning Signs
The electrical equipment sector is experiencing a boom driven by AI data center construction and grid modernization, but a recent analysis shows that high stock valuations may pose a significant risk to investors.

Nvidia Stock Hits New All-Time High on Record Buyback and Analyst Upgrade
Shares of the chipmaker surged to a new record after a five-month consolidation, propelled by a historic share repurchase authorization, a bullish analyst note, and sustained demand for its AI hardware.

Power Solutions Options Dominated by Large Bullish Spread Targeting $60 Strike
A single, complex options trade accounted for nearly all volume in Power Solutions International, suggesting a trader is rolling a bullish bet to a higher strike price and a later expiration.