
Story
Copper Price Tests Critical $6.58 Support as Bearish Technical Signals Emerge
Summary
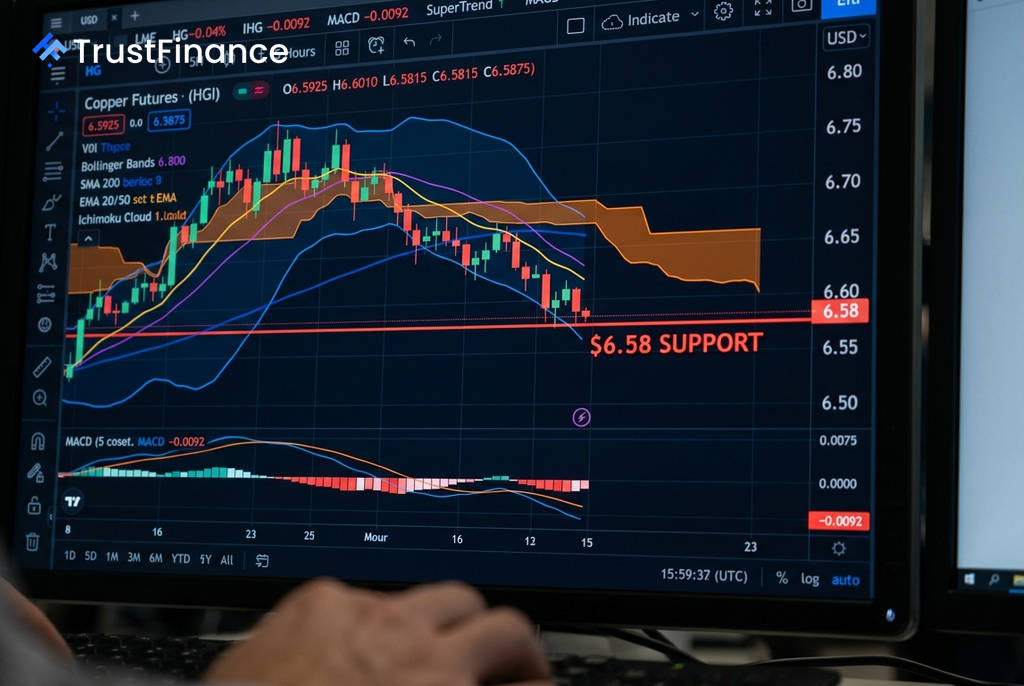
Copper is at a pivotal technical juncture, testing the key $6.58 support level. A decisive break below this price could confirm a short-term bearish reversal, according to a recent technical analysis.
Copper prices are testing a critical support level at $6.58, a price point that could determine the industrial metal's short-term direction. According to a technical analysis from Investing.com, a failure to hold this level would confirm a bearish trend reversal, as multiple indicators are flashing warning signs for bulls.
A Chart at a Crossroads
The analysis, based on a 5-hour chart, highlights that the $6.58 level is the neckline of a potential "double top" pattern, a classic bearish reversal formation. A conclusive close below this price would validate the pattern and likely attract further selling pressure.
This level also coincides with support from the SuperTrend indicator, reinforcing its technical significance. Traders are closely watching for a decisive break, which could serve as a confirmation signal for a new downtrend.
Mounting Bearish Pressure
Several technical indicators are signaling a shift in momentum in favor of sellers. These include:
 Ad
Ad- Moving Averages: The price is currently trading below both the 20-period and 50-period moving averages, which stand at approximately $6.62.
- Ichimoku Cloud: Copper has fallen below the Ichimoku cloud, a key indicator of trend and momentum, which currently provides resistance in the $6.62-$6.64 range.
- MACD: The Moving Average Convergence Divergence (MACD) indicator shows accelerating downward momentum, with its value of -0.0092 falling below its signal line.
Key Support and Resistance Zones
While short-term signals appear bearish, some underlying support remains. The longer-term 200-period moving average is at $6.36, suggesting the broader uptrend is not yet broken. A key support zone is identified between $6.50 (a 38.2% Fibonacci retracement level) and $6.54 (the lower Bollinger Band).
Conversely, the bearish outlook would be invalidated if the price were to rebound and establish a firm hold above the $6.70 resistance level. The zone between $6.58 and $6.62 is considered a period of indecision where bulls and bears are in a tight contest.
Read next
More on Commodities
Wheat Futures Decline on Technical Selling as Crude Oil Weakens
Chicago wheat futures edged lower on Wednesday, pressured by technical selling linked to a downturn in crude oil prices, though losses were limited by ongoing global supply concerns.

Raw Sugar Futures Slip as Declining Oil Prices Weigh on Ethanol Demand
Raw sugar futures edged lower as a drop in crude oil prices made ethanol production less profitable, incentivizing mills to produce more sugar. However, prices found support from forecasts of lower crop yields in key producing regions.

Continental Resources Signs MOU with Venezuela's PDVSA to Develop Orinoco Oil Field
U.S.-based Continental Resources has entered a preliminary agreement with Venezuela's state-owned oil company, PDVSA, to jointly develop a block in the Orinoco Heavy Oil Belt estimated to hold 30 billion barrels of oil.

Soybean Futures Rise on Hopes for U.S.-China Trade Talks
CBOT soybean futures closed higher Wednesday, supported by news of a planned meeting between top U.S. and Chinese officials which has raised expectations for stronger export demand.